Curated OER
Favorite Food
Students are given three choices of food. They then decide on their favorite and predict what the class's favorite food will be. After the teacher enters the data into the computer, students gather around the computer to view the...
Curated OER
Healthy Food Choices
Students identify healthy food choices. In this nutrition lesson, students review the food pyramid and write down their favorite food on a post-it note. Students create a bar graph of favorite foods using the post-it notes.
Curated OER
Bar Graphs
Students perform operations and graph their data using charts and bar graphs. In this algebra lesson, students follow specific steps to make a bar graph. They create a survey about people favorite things and plot their data from the...
Curated OER
Meats Make Muscles
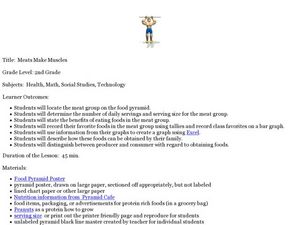
Second graders explore the meat group of the food pyramid. For this nutrition and diet lesson, 2nd graders study the benefits of eating foods in the meat group, collect data regarding their classmates' favorite foods, and create a graph...
Curated OER
Moo-Velous Butter!
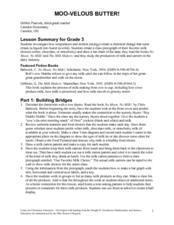
Third graders investigate how temperature and motion (energy) create a chemical change that turns cream ( a liquid) into butter (a solid). They create a class pictograph of their favorite mils choices (white, chocolate, or strawberry)...
Curated OER
The Numbers Tell the Story
Students demonstrate how to gather and interpret statistical data. In this data analysis lesson plan, students search for statistics on the health effects of smoking and place the information into charts. Students create these charts...
Curated OER
Stick Out Your Tongue
Students explore their sense of taste and recognize good foods to eat. In this tasting lesson plan, students recognize that their tongue has taste buds for different types of tastes. Students create a bar graph showing their favorite...


