Curated OER
Dependence of Light Intensity on Distance
Hopefully you have a sensor interface for your physics class to use with graphing calculators when collecting data with a light sensor. If so, read on. Use this resource for learners to predict and then test whether or not the intensity...
Curated OER
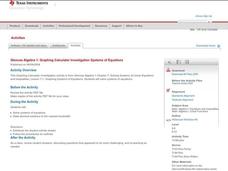
Systems of Equations
Texas Instruments and Glencoe/McGraw-Hill have put together a full lesson to help you instruct your math class. Using the textbook, a TI-83 calculator, and attached the PDF learners will solve systems of equations and state decimal...
Texas Instruments
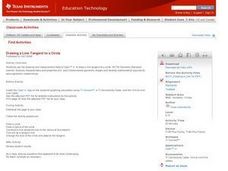
Drawing a Line Tangent to a Circle
Explore lines tangent to a circle. In this math lesson plan, high schoolers manipulate circles and lines on a TI calculator. They draw a circle and analyze perpendicular lines intersecting the circle in only one place. This activity...
Texas Instruments
Graphing Calculator Investigation Graphs of Relations
Learners investigate relations in this algebra lesson. They graph the set of ordered pairs that determine a relation. Using a TI-83 Plus, your learners will enter the coordinates in a list, create a scatter plot, and manipulate the...
Curated OER
Time That Period
Physical science starters play with a pendulum in order to experience periodicity. Detailed procedures and a worksheet are included for day one. For day two, learners will use a graphing calculator to help them plot orbit data from a...
Curated OER
Investigating Linear Equations Using Graphing Calculator
Students investigate linear equations using the Ti-Calculator. In this algebra lesson plan, students graph lines and identify the different quadrants on a coordinate plane. They identify ordered pairs used to plot lines.
Curated OER
Making Connections: Matrices, Graph, Linear Systems
In this set of activities, matrices and equations are explored. They work with matrices using pen and paper as well as graphing calculator. Additionally real-world problems are explored.
Curated OER
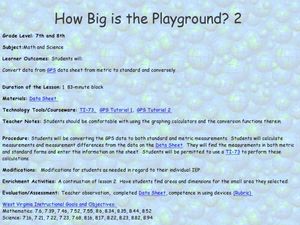
How Big Is The Playground?
Students calculate the standard and metric measurements of a playground. In this measurement instructional activity, students use GPS coordinates and graphing calculators to determine the dimensions of an area outside of the school in...
Curated OER
The Barbie Bungee Drop
What do math, bungee jumping, and Barbie® have in common? Young adventure seekers use rubber bands as bungee cords to predict a thrilling, but safe, jump for their doll. First, test jumps are conducted with a few rubber bands. Then more...
Curated OER
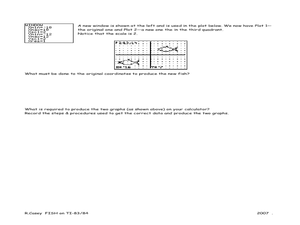
Fishing for Points TI-83/83 Plus
Ninth graders investigate the Cartesian coordinate plane. In this Algebra I instructional activity, 9th graders explore the coordinates of a drawing of a fish and examine the effects of moving the drawing on the ordered pairs. Students...
Curated OER
Solving Trigonometric Equations
Pupils will investigate trigonometric equations. In this trigonometry lesson, they explore solving equations using a TI-83 calculator and solve trigonometric equations by graphing each side of the equation as a function and locating the...
Curated OER
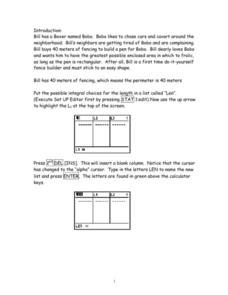
A Boxer named Bobo
Bobo the Boxer needs a pen and algebra learners need to find the maximum area that can be created from a fixed amount of fence. A graphing calculator is used to assist in their exploration.
Texas Instruments
Light and Day
Pupils explore the concept of collecting data as they collect data on their graphing calculator about time, temperature, and light. Learners plot the data and create histograms and box and whisker plots to analyze the data.
Curated OER
Graphing and Interpreting Linear Equations in Two Variables
Graph linear equations using a table of values. Learners solve equations in two variables using standard form of an equation. They identify the relationship between x and y values.
Curated OER
Another Way of Factoring
Focusing on this algebra lesson, learners relate quadratic equations in factored form to their solutions and their graph from a number of different aspects. In some problems, one starts with the original equation and finds the solutions....
Curated OER
Coordinate Graphs, Translations and Reflections
Students perform translations and reflections. In this algebra lesson, students use the TI calculator to graph functions. They move the functions around on the coordinate plane using translation and reflection.
Curated OER
Connecting Factors and Zeros
In this Algebra II lesson, students explore the connection between the factored form of a quadratics and the zero of a function. Students use a graphing calculator to verify factoring numerically and graphically.
Curated OER
The Closer I Get To You
Pupils explore the law of reflection. Through experimentation and problem solving, they collect and analyze data pertaining to reflection. The data is plotted on a graph and formulas for calculating the x and y values are evaluated.
Curated OER
Means of Growth
Students collect and graph data. In this statistics lesson, students analyze their plotted data using a scatter plot. They identify lines as having positive, negative or no correlation.
Curated OER
Slopes and Lines
Pupils identify the slopes of a line. In this algebra lesson plan, students calculate the slope and intercept of a line. They graph their lines using a TI calculator.
Curated OER
Know the System
Learners identify the different systems of equations. In this algebra lesson plan, students solve systems of equations using graphing, elimination and substitution. They use the Ti to graph their systems.
Curated OER
Baseball Statistics
Students take an in depth examine baseball record breakers. They calculate statistics, not just for one year, but over whole careers, to compare some famous players and find who was the best all-time home run hitter.
Curated OER
Regressive Music
Student use the Ti calculator to graph sinusoidal graphs. In this calculus lesson, high schoolers use the CBL to collect and analyze data of sinusoidal graphs. They manipulate their collected data and make predictions.
Curated OER
The Swinging Pendulum
Students observe a pendulum and graph their observation. In this algebra lesson, students use the TI calcualtor to graph the motion the pendulum makes. They analyze the graph and make predictions.


