Curated OER
Systems of Equations
Texas Instruments and Glencoe/McGraw-Hill have put together a full lesson to help you instruct your math class. Using the textbook, a TI-83 calculator, and attached the PDF learners will solve systems of equations and state decimal...
Texas Instruments
Drawing a Line Tangent to a Circle
Explore lines tangent to a circle. In this math lesson plan, students manipulate circles and lines on a TI calculator. They draw a circle and analyze perpendicular lines intersecting the circle in only one place. This activity...
Curated OER
Dependence of Light Intensity on Distance
Hopefully you have a sensor interface for your physics class to use with graphing calculators when collecting data with a light sensor. If so, read on. Use this resource for learners to predict and then test whether or not the intensity...
Curated OER
Solving Trigonometric Equations
Pupils will investigate trigonometric equations. In this trigonometry lesson, they explore solving equations using a TI-83 calculator and solve trigonometric equations by graphing each side of the equation as a function and locating the...
Curated OER
The Barbie Bungee Drop
What do math, bungee jumping, and Barbie® have in common? Young adventure seekers use rubber bands as bungee cords to predict a thrilling, but safe, jump for their doll. First, test jumps are conducted with a few rubber bands. Then more...
Curated OER
Investigating Linear Equations Using Graphing Calculator
Students investigate linear equations using the Ti-Calculator. For this algebra lesson, students graph lines and identify the different quadrants on a coordinate plane. They identify ordered pairs used to plot lines.
Texas Instruments
Graphing Calculator Investigation Graphs of Relations
Learners investigate relations in this algebra lesson. They graph the set of ordered pairs that determine a relation. Using a TI-83 Plus, your learners will enter the coordinates in a list, create a scatter plot, and manipulate the...
Curated OER
Time That Period
Physical science starters play with a pendulum in order to experience periodicity. Detailed procedures and a worksheet are included for day one. For day two, learners will use a graphing calculator to help them plot orbit data from a...
Curated OER
Making Connections: Matrices, Graph, Linear Systems
In this set of activities, matrices and equations are explored. They work with matrices using pen and paper as well as graphing calculator. Additionally real-world problems are explored.
Curated OER
Fishing for Points TI-83/83 Plus
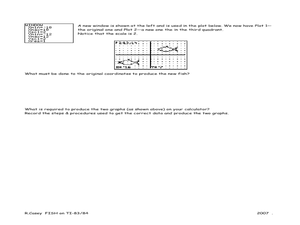
Ninth graders investigate the Cartesian coordinate plane. In this Algebra I lesson, 9th graders explore the coordinates of a drawing of a fish and examine the effects of moving the drawing on the ordered pairs. Students predict the...
Curated OER
The Closer I Get To You
Pupils explore the law of reflection. Through experimentation and problem solving, they collect and analyze data pertaining to reflection. The data is plotted on a graph and formulas for calculating the x and y values are evaluated.
Curated OER
Graphing and Interpreting Linear Equations in Two Variables
Graph linear equations using a table of values. Learners solve equations in two variables using standard form of an equation. They identify the relationship between x and y values.
Curated OER
Bouncing Ball
High schoolers collect height versus time data of a bouncing ball using the CBR 2™ data collection device. Using a quadratic equation they graph scatter plots, graph and interpret a quadratic function, apply the vertex form of a...
Curated OER
Another Way of Factoring
Focusing on this algebra instructional activity, learners relate quadratic equations in factored form to their solutions and their graph from a number of different aspects. In some problems, one starts with the original equation and...
Curated OER
Ashes to Ashes: Using Evaporation Rate to Identify an Unknown Liquid
Learners explore the concept of evaporation rates in this evaporation rates lesson. They will try to identify the chemical that began a fire, perform an experiment where they use the evaporation rates to determine the unknown liquid, and...
Curated OER
Reflecting a Triangle in the Coordinate Plane
Learners explore geometric concepts using technology. They manipulate the TI to find important math topics. This activity requires a TI-84 or higher.
Curated OER
Coordinate Graphs, Translations and Reflections
Students perform translations and reflections. In this algebra lesson, students use the TI calculator to graph functions. They move the functions around on the coordinate plane using translation and reflection.
Curated OER
How Big Is The Playground?
Students calculate the standard and metric measurements of a playground. In this measurement instructional activity, students use GPS coordinates and graphing calculators to determine the dimensions of an area outside of the school in...
Curated OER
The Quest for Roots of Higher Order Equations
Young mathematicians explore the concept of solutions to higher order equations as they find roots of polynomials of degree three or higher. They also use the zero function on the Ti-83 to locate zeros of polynomials on a graph.
Curated OER
Proof of the Pythagorean Theorem Using Transformations
Middle and high schoolers construct a triangle using Cabri Jr. They construct squares on each of the legs and hypotenuse of the triangle. Pupils show that the area of the squares on the leg equal the area of the square on the hypotenuse.
Curated OER
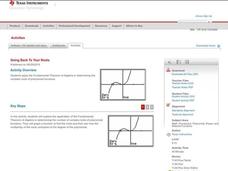
Going Back to Your Roots
Who doesn't need to know the Fundamental Theorem of Algebra? Use the theorem to find the roots of a polynomial on a TI calculator. The class explores polynomials with one solution, no real solutions, and two solutions. This less lesson...
Curated OER
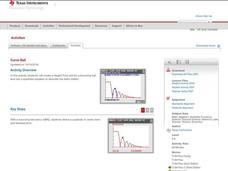
Curve Ball
Learners explore the concept of parabolas by collecting quadratic data on a bouncing ball as it is falling using a motion detector. They plot the data and determine the equation of the quadratic in vertex form, then determine the values...
Curated OER
Slopes and Lines
Pupils identify the slopes of a line. In this algebra activity, students calculate the slope and intercept of a line. They graph their lines using a TI calculator.
Curated OER
Visualizing Vectors
Investigate vectors in standard positions and use the CellSheet application on the TI calculator to find the sum of two vectors. Convert from polar to rectangular coordinates and vice versa, and show graphs of the vectors.
