EngageNY
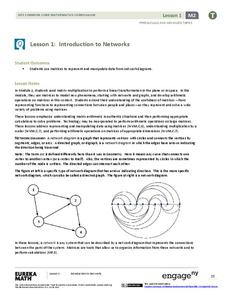
Introduction to Networks
Watch as matrices break networks down into rows and columns! Individuals learn how a network can be represented as a matrix. They also identify the notation of matrices.
Curated OER
Class Birthday Graph
Students analyze the basics of an Excel spreadsheet. They highlight cells in a spreadsheet. They make a column graph. Students are introduced to X-axis and Y-axis. They play various address games on the spreadsheet.
Curated OER
Graphing Data
Second graders graph data about their classmates. In this data analysis activity, 2nd graders ask each other several questions about their hair color and eye color. Students graph the data that they collected.
Curated OER
Apple Graphing
Do you like apples? Create a taste test for your first and second grade learners. Cut red, green, and yellow apples, and have learners select their favorite. After tasting all of the apples, they collect data and graph the results with...
Curated OER
Using Averages to Create Graphs Through Excel
Sixth graders create and use a spreadsheet to make graphs which will be used to analyze Progress Report and Final Report Card grades. They practice finding the mean, median, mode, and range of a data set. Students also incorporate column...
SeaWorld
Marvelous Manatees
Here is an interesting lesson plan on the manatee for your upper graders or middle schoolers. A game is played where learners work together to complete a successful manatee migration. It's a board game, and all of the game components are...
Curated OER
Our Favorite Season Lesson Plan
Fifth graders complete a survey about their favorite season of the year. Using Excel, they create a graph using the chart wizard and copy it into Microsoft Word. They explore the relationship between the survey and the bar graph.
Curated OER
Graphing Weights and Measures
Learners practice gathering, averaging, and graphing data. They practice converting measurements to the metric system. Students graph their results and present them to the class.
Curated OER
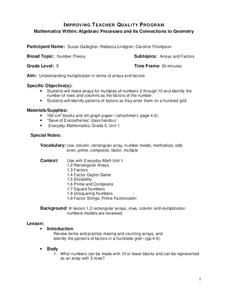
Mathematics Within: Algebraic Processes and Its Connections to Geometry
Fifth graders discover the connections between algebra and geometry. With a focus on arrays and factors, they are introduced to multiplication. They develop an array for multiples of 2 through 10 and identify the factors of each row....
Curated OER
M & Ms in a Bag
Students make predictions about the number and colors of M&M's in a snack size package. They create an Excel spreadsheet to record the data from their small group's bag, create a graph of the data, and discuss the variations of data...
Curated OER
Math: Collecting and Analyzing Date
Children count how many of an activity they can do in a row, such as ball tossing and record the date and count. Children track over a period of time and graph results.
Curated OER
Weights and Measures
Students master the gathering, averaging and graphing of data. They practice conversion to metric measures. They gain fluency in the use of technology tools for math operations.
Physics Classroom
Action-Reaction Lab
Computer-interfaced motion detectors are required to carry out this inquiry. It is a new twist on exploring motion with plunger carts: they are set back-to-back and then propelled away from each other. Their velocities are measured, and...
Curated OER
All About Me: Measuring Height and Weight
Young scholars take personal fitness inventories. For this personal health lesson, students take measurements of their heights and weights. Young scholars record the data, calculate their BMI, and then chart their physical activity.
Curated OER
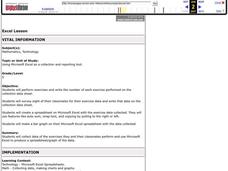
Excel Lesson
Fifth graders will perform exercises and write the number of each exercise performed on the collection data sheet. They survey eight of their classmates for their exercise data and write that data on the collection data sheet. They then...
Curated OER
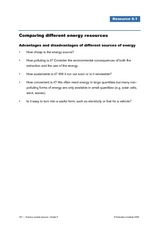
Comparing Different Energy Resources
Young scholars examine the advantages and disadvantages of the different sources of energy. In this energy lesson students complete an experiment and worksheet.
Curated OER
Growing Rock Candy
Students observe the growth of rock candy. In this crystal growth lesson, students make rock candy and measure the crystal growth over five days.
Curated OER
Have Respect
Students learn the value of respect. In this Clifford the Big Red Dog lesson plan, students read the story, discuss respect, and experience a mini-international festival.
Curated OER
DASH Sunrise and Sunset/ Seasons Chart
Second graders rotate as the person to enter the information of sunrise and sunset into a spreadsheet. The teacher also demonstrates how to convert the spreadsheet into a chart.
Curated OER
Particulate Sampler
Middle schoolers estimate the extent of particulate air pollution present in their neighborhoods.
Curated OER
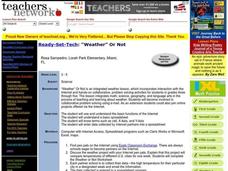
Weather Or Not
Students use the internet to find pen pals to share in their weather experiment. Individually, they research the high and low temperatures for cities within the United States and email the results to their pen pal. They also develop a...
