Curated OER
Usage and Interpretation of Graphs
Students explore graphing. In this graphing lesson, students predict how many shoe eyelets are present in the classroom. Students count eyelets and work in groups to organize and chart the data collected. Students put all the data...
Curated OER
Play It
There are a number of activities here that look at representing data in different ways. One activity, has young data analysts conduct a class survey regarding a new radio station, summarize a data set, and use central tendencies to...
EngageNY
Graphing the Tangent Function
Help learners discover the unique characteristics of the tangent function. Working in teams, pupils create tables of values for different intervals of the tangent function. Through teamwork, they discover the periodicity, frequency, and...
Curated OER
Introduction to Representing and Analyzing Data
Represent data graphically. Allow your class to explore different methods of representing data. They create foldables, sing songs, and play a dice game to reinforce the measures of central tendency.
Futures Channel
Folding Circles
Students investigate properties of circles. In this geometry lesson, students differentiate between similarity and congruence as they observe polygons. They investigate properties of two and three dimensional shape.
Curated OER
Graphs
Students investigate circle and bar graphs. In this middle school mathematics lesson, students determine which kind of graph is suitable for a given situation and create circle and bar graphs.
Curated OER
Investigation - The M & M Mystery
Sixth graders inspect M&M's to complete statistical data. Students interpret percent of colors represented. They convert data from decimals, fractions, and percents. Using the data, 6th graders create a bar graph and a circle graph.
Curated OER
Discovering Pi/Welcome to Pi Day
Learners explore pi. In this circle measurement lesson, students define and identify radius, diameter, circumference, and perimeter. Learners work in groups to measure several plastic lids and record their findings. Students compare the...
EngageNY
Solution Sets to Inequalities with Two Variables
What better way to learn graphing inequalities than through discovering your own method! Class members use a discovery approach to finding solutions to inequalities by following steps that lead them through the process and...
Mathematics Assessment Project
Sorting Equations of Circles 2
How much can you tell about a circle from its equation? This detailed lesson plan focuses on connecting equations and graphs of circles. Learners use equations to identify x- and y-intercepts, centers, and radii of circles. They also...
Curated OER
Interpreting and Displaying Sets of Data
Students explore the concept of interpreting data. In this interpreting data instructional activity, students make a line plot of themselves according to the number of cubes they can hold in their hand. Students create their own data to...
Curated OER
Speed
Fifth and sixth graders practice working in pairs to determine whether they can walk with constant speed. They test themselves, collect their data, draw graphs with their data collected, manipulate the data, and then draw conclusions...
EngageNY
Graphing Systems of Equations
Expand on learners' understanding of quadratic-linear systems. Building on the graphic understanding developed in the previous lesson, pupils learn algebraic methods of solving the systems.
Curated OER
Analyzing Graphs and Data
Students collect and analyze data. In this statistics lesson, students graph their data and make inferences from the collected data. They display their data using graphs, bar graphs, circles graphs and Venn diagrams.
EngageNY
Why Call It Tangent?
Discover the relationship between tangent lines and the tangent function. Class members develop the idea of the tangent function using the unit circle. They create tables of values and explore the domain, range, and end behavior of...
Curated OER
Graphing Data Brings Understanding
Students collect, graph and analyze data. For this statistics lesson, students use circle, pie, bar and lines to represent data. They analyze the data and make predictions bases on the scatter plots created.
Curated OER
Evidence of Change Near the Arctic Circle
Students analyze graphs and make conclusions about climate change. In this climates lesson students produce graphs and identify relationships between parameters.
Curated OER
Reading Graphs
Students read graphs and charts to interpret results. In this algebra lesson, students interpret bar, line and pictographs. They draw conclusions and make predicitons based on these charts.
Curated OER
The Numbers Tell the Story
Students demonstrate how to gather and interpret statistical data. In this data analysis lesson, students search for statistics on the health effects of smoking and place the information into charts. Students create these charts online...
Curated OER
Circle Relationships
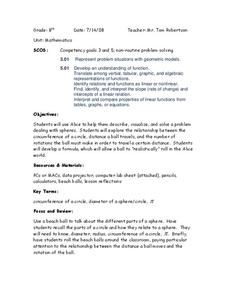
Students explore circles. In this geometry lesson, students explore the relationship between the circumference of a circle, the distance a ball travels, and the number of rotations the ball must make in order to travel a certain...
Curated OER
Discovering Pi
Define terminology related to a circle. Practice accuracy in measuring and then create a spreadsheet based on data collected from solving for parts of a circle. Groups can have fun analyzing their data as it relates to Pi.
Curated OER
Getting Graphs: Researching Genealogy-A Piece of Pie
Third graders research their genealogy. In this math lesson, 3rd graders collect data and create graphs and charts. A presentation of their findings is given.
Curated OER
Analyzing Visual Symbols
Young scholars analyze and identify visual symbols in everyday life and during a museum visit. In this visual symbol lesson, students study associated vocabulary such as analyze and interpret. They find and note attention getting symbols...
Curated OER
Is there Treasure in Trash?
More people, more garbage! Young environmentalists graph population growth against the amount of garbage generated per year and find a linear model that best fits the data. This is an older resource that could benefit from more recent...


