Curated OER
Linear Functions-Learn Your Lines
Students solve and graph linear equations. In this algebra activity, students collect and plot data on a coordinate plane. They use the CBL and TI calculator to graph systems of equation.
Radford University
Real World Data
Make math class feel more real by using real-world data. Scholars research or collect data on several different topics, such as nutrition, the motion of moving objects, cooling curves, and daylight hours. They create scatter plots using...
Curated OER
Thirst Dilemma (Drinking in the Desert)
Ninth graders explore linear functions. In this Algebra I instructional activity, 9th graders collect and analyze date as they investigate the question of how long will water last if you are trapped in a desert. Students create...
Curated OER
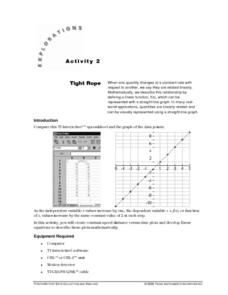
Tight Rope
Learn how to explore the concept of linear functions. In this linear functions lesson, young scholars collect linear data from a motion detector. Students walk to create a linear function. Young scholars plot the points on a graph and...
Curated OER
Flipping Coins: Density as a Characteristic Property
Young scholars explore linear functions in a crime solving context. They collect and analyze data using linear equations, then interpret the slope and intercepts from a linear model.
Intel
Track the Trends
Allow your classes to research what interests them. An engaging STEM lesson, the fourth in the series of six, asks individuals to choose a topic of interest and analyze the data through regression models. The regression equations allow...
Virginia Department of Education
Logarithmic Modeling
Explore logarithms and logarithmic regression. Young mathematicians first learn about inverse functions and about the logarithm function family. They take their newfound knowledge to use logarithmic functions to model situations and...
Curated OER
US Households
Learners construct and use inverse functions to model a real-world context. They use the inverse function to interpolate a data point.
EngageNY
Modeling with Polynomials—An Introduction (part 2)
Linear, quadratic, and now cubic functions can model real-life patterns. High schoolers create cubic regression equations to model different scenarios. They then use the regression equations to make predictions.
Curated OER
Line of Best Fit
Students explore the concept of linear regression. In this linear regression instructional activity, students do a Barbie bungee activity where they collect linear data. Students plot their data using a scatter plot. Students determine a...
Curated OER
Linear Regression (and Best Fit)
High schoolers explore notions of relationships between two variables. They use discussion, games, worksheets, spreadsheets to consider relationships such as: height vs. shoe size, cricket chirping vs. temperature.
Curated OER
Make a Pass at Me
Learners identify different types of functions and units of measurements. In this statistics lesson plan, students will collect data, graph their data and make predictions about their data. They plot a linear regression graph.
Curated OER
Approximation of Pi
Young scholars explore the concept of Pi. In this Pi lesson, students measure the circumference and diameter of a circle. Young scholars record the diameter and circumference measurements from their classmates. Students enter the data...
Curated OER
The Barbie Bungee Drop
What do math, bungee jumping, and Barbie® have in common? Young adventure seekers use rubber bands as bungee cords to predict a thrilling, but safe, jump for their doll. First, test jumps are conducted with a few rubber bands. Then more...
EngageNY
Exponential Growth—U.S. Population and World Population
Show how exponential growth can look linear. Pupils come to understand the importance of looking at the entire picture as they compare the US population to the world population. Initially, the populations look linear with the same rate...
Curated OER
Price of Apples- Linear Data
Students collect data and create a graph. In this algebra instructional activity, students describe functions graphically, algebraically and verbally. They identify functions as being independent and dependent using variables.
Curated OER
How Do They Relate? Linear Relationship
Young scholars collect information and use a line to represent it. In this algebra lesson, students investigate real world data to see if it makes a line. They graph the line comparing the relationship of the x axis with that of the y axis.
Curated OER
Pi Day: The Other Math Holiday!
Happy Pi Day! This collection of games, experiments, and activities leads participants through an exploration of the many aspects and attributes of that mysterious quantity, pi. Activities range from using statistical experimentation to...
Radford University
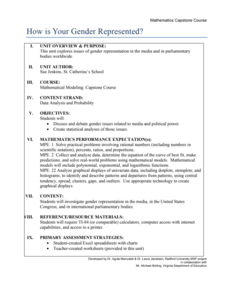
How Is Your Gender Represented?
Does the media shape people's views on gender? Scholars use data on gender portrayal in magazines to explore the idea. They use a spreadsheet program to create bar graphs and perform a chi-square test. They also use provided data to...
Curated OER
Curve Fitting
Pupils investigate linear, quadratic, and exponential regressions. They plot sets of data points, determine the regression equation that best fits the data and lastly investigate the coefficient of determination.
Curated OER
Strike a Pose: Modeling in the Real World (There's Nothing to It!)
Adjust this lesson to fit either beginning or more advanced learners. Build a scatter plot, determine appropriate model (linear, quadratic, exponential), and then extend to evaluate the model with residuals. This problem uses real-world...
Mathalicious
XBOX Xpotential
Touchdown! This is an exponentially insightful instructional activity that explores the growth of football games with different video game consoles. Class members discuss whether the increase of mergahertz can be described as linear or...
Curated OER
Modeling Population Growth
Students collect data on population growth. In this statistics lesson, students graph their data and make predictions. They find the linear regression and the best fit line.
Radford University
Sleep and Teen Obesity: Is there a Correlation?
Does the number of calories you eat affect the total time you sleep? Young mathematicians tackle this question by collecting their own data and making comparisons between others in the class through building scatter plots and regression...
Other popular searches
- Linear Regression Us Census
- Algebra Linear Regressions
- Linear Regression Excel
- Statistics Linear Regression
- Non Linear Regression
- Linear Regression Census
- Linear Regression Ti83
- Linear Regression Calories
- Linear Regression Analysis


