EngageNY
Modeling with Quadratic Functions (part 2)
How many points are needed to define a unique parabola? Individuals work with data to answer this question. Ultimately, they determine the quadratic model when given three points. The concept is applied to data from a dropped...
CK-12 Foundation
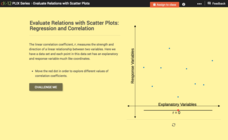
Evaluate Relations with Scatter Plots: Regression and Correlation
Introduce the concept of a correlation coefficient using an interactive lesson. Learners begin by manipulating a correlation coefficient and watching a graph change to represent the new value. Questions help strengthen their...
EngageNY
Using Sample Data to Estimate a Population Characteristic
How many of the pupils at your school think selling soda would be a good idea? Show learners how to develop a study to answer questions like these! The lesson explores the meaning of a population versus a sample and how to interpret the...
Balanced Assessment
Fermi Estimates I
Enrico Fermi, the physicist responsible for the first nuclear detonation, was known for his ability to estimate with little or no data. Use this task to have your classes practice their Fermi skills. They estimate the magnitude of three...
CK-12 Foundation
Midpoint and Segment Bisectors: Midpoint Map
Discover how to find a midpoint with a conceptual exploration. Scholars manipulate a point to determine the location of a midpoint on a straight line distance between two locations. Later questions extend to determine the...
CK-12 Foundation
When to Use the Distributive Property: Rational Expressions
Discover how the distributive property applies to division. As learners change numeric values within an expression, the simulation calculates its value. Challenge questions lead individuals to realize the power of distributing the...
CK-12 Foundation
Line Graphs to Display Data Over Time: Strawberry Competition
Take the tediousness out of graphing. Using the interactive tool, learners can efficiently create a line graph from a set of data. They then use the graph to answer questions about specific trends in the data.
Balanced Assessment
Initials
Learners explore the meaning of groups formed through permutations and combinations with an activity that asks individuals to determine the total number of pupils needed to guarantee that at least one pair has the same initials....
CK-12 Foundation
Direct Variation: Value of a Painting
Help your pupils find a pattern of direct variation. Young scholars use input-output pairs to find a constant of variation and then write the equation. As they build their equations, the interactive lesson provides feedback.
Balanced Assessment
Survey Says
Examine statistical data that shows an overlap in responses. The data tallies over 100% and learners interpret this data characteristic. They then create a graph to represent the data.
Curated OER
What's Playing Tonight?
Students collect data and visually represent it. They conduct a survey of favorite movies. Using a spreadsheet, students organize the data and create bar and circle graphs. Students answer statistical questions regarding the data.
EngageNY
Comparing Quadratic, Square Root, and Cube Root Functions Represented in Different Ways
Need a real scenario to compare functions? This lesson plan has it all! Through application, individuals model using different types of functions. They analyze each in terms of the context using the key features of the graphs.
EngageNY
Making Scale Drawings Using the Parallel Method
How many ways can you create a dilation? Many! Individuals strengthen their understanding of dilations by using various methods to create them. The new technique builds on pupils' understanding of the ratio method. Using the ratio,...
EngageNY
The Side-Angle-Side (SAS) and Side-Side-Side (SSS) Criteria for Two Triangles to Be Similar
Playing with mathematics can invoke curiosity and excitement. As pupils construct triangles with given criteria, they determine the necessary requirements to support similarity. After determining the criteria, they practice...
EngageNY
When Can We Reverse a Transformation? 2
The second lesson on finding inverse matrices asks class members to look for a pattern in the inverse matrix and test it to see if it works for all matrices. The teacher leads a discussion to refine the process in finding inverses,...
EngageNY
Ruling Out Chance (part 2)
Help your classes find the significance in this lesson! Learners analyze the probability of Diff values. They then determine if the difference is significant based on their probability of occurrence.
CK-12 Foundation
Angle Measurement: Adding Angles
Build angles from angles. Using the Angle Addition Postulate, learners find the measures of unknown angles. The interactive simulation shows a visual representation of the postulate and allows individuals to manipulate the angles and...
EngageNY
Making Scale Drawings Using the Ratio Method
Is that drawn to scale? Capture the artistry of geometry using the ratio method to create dilations. Mathematicians use a center and ratio to create a scaled drawing. They then use a ruler and protractor to verify measurements.
Curated OER
Getting into Shape
Young scholars identify 3-D geometric shapes through different pieces of artwork. They examine and identify segments and angles. Students act out shapes and create a piece of artwork. Additional cross curriculum activities are listed.
Curated OER
Accounting
Students create bank reconciliation spreadsheet. In this algebra lesson, students discuss the basics about business, money and bank accounts. They use a bank reconciliation statement correctly.
Curated OER
Data and Scientific Graphs
Learners conduct experiments and graph their data. In this statistics lesson, students collect data and graph it on a coordinate plane. They analyze the data looking for patterns and they discuss their findings with the class.
Curated OER
Creeping Sheets of Ice
Students conduct scientific investigation in which they observe glacial
effects on landscape, develop and explain their own theories of how glaciers change land, and demonstrate understanding and explain basic motion and force principles.
Curated OER
Anamorphosis
Students classify optical illusions according to their distinguishing characteristics. They create anamorphic art and use Mylar flexible mirrors to view and then they describe and analyze the optical illusion.
Curated OER
Golden Connections
Students determine the ratio of pairs of consecutive terms in the Fibonacci Sequence. Using four different colors, they create a golden rectangle in either two or three dimensions. They use photographs to create two collages using...


