Curated OER
The Candy Color Caper
Students explore the concept of probability. They calculate the probability of an event happening and graph their results. Students determine the probability of winning a sweepstakes. They construct a bar graph to represent all the...
EngageNY
Margin of Error When Estimating a Population Proportion (part 2)
Error does not mean something went wrong! Learners complete a problem from beginning to end using concepts developed throughout the last five lessons. They begin with a set of data, determine a population proportion, analyze their result...
Curated OER
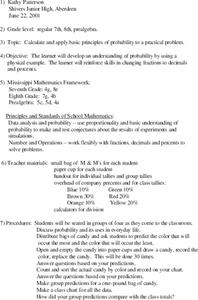
Probability using M & M's
Using M & M's candies, young statisticians predict the color distribution in a packet of candies and test their predictions against their group and the larger class. A review of converting between fractions, decimals, and percents...
Curated OER
Probability Lesson Plan
Your learners will examine probability through experiments and dice games. Using a computer, your class will perform simple experiments to collect and analyze data to determine the probability of different experimental results. Students...
Curated OER
Probability Activity
Learners differentiate between theoretical and experimental probability. In this probability activity, students create a puzzle and calculate the probability of an event occurring. They use problems dealing real life scenarios.
Curated OER
The Probability Scale
Pupils collect data and make predictions. In this probability lesson plan, students perform experiments calculating the chance of an event occurring. They draw conclusion based on their data.
Google
The Law of Large Numbers and Probability
Learners investigate why theoretical probability doesn't always match reality. The activity involves using Python 2.7 (or Sage) to set up a Bernoulli Trial. It also involves setting up a spreadsheet to simulate the Birthday Paradox....
Curated OER
Matchstick Math: Using Manipulatives to Model Linear, Quadratic, and Exponential Functions
Playing with matches (unlit, of course) becomes an engaging learning experience in this fun instructional unit. Teach pupils how to apply properties of exponential functions to solve problems. They differentiate between quadratic and...
Curated OER
Applied Science - Science and Math Lab
Create three dimensional objects in an applied science instructional activity. The goal is for your class to recognize, compare, and model shapes. Using cookie cutters and clay or play dough, they create models for three-dimensional shapes.
Mathalicious
Domino Effect
Carryout the instructional activity to determine the cost of pizza toppings from a Domino's Pizza® website while creating a linear model. Learners look through real data—and even create their own pizza—to determine the cost of each...
Curated OER
Heads or Tails
Seventh graders compare experimental and theoretical probabilities. For this comparing experimental and theoretical probabilities lesson, 7th graders discuss the theoretical probability of flipping a coin. Students flip a coin 25 times...
Curated OER
Probability & Game Theory
Young scholars explore the concept of probability. In this probability lesson, students perform various probability experiments including flipping a coin, picking m&m's out of a bag, and the birthday problem.
Curated OER
Probability
Seventh graders explore probability. In this probability lesson, 7th graders investigate modern day uses of probability. Students demonstrate probability through an experiment using dice.
Texas Instruments
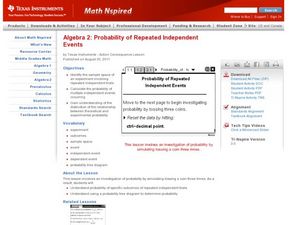
Probability of Repeated Independent Events
Statisticians analyze different samples to find independent and dependent events. In this probability lesson, pupils predict the outcome and then calculate the real outcome. They create a tree diagram to help predict the probability of...
Curated OER
Probability Popsicle Pop-ups
Fourth graders decorate and use popsicle sticks as manipulatives to assist with their learning of probability. They utilize a worksheet imbedded in this plan to organize the results of their experiment. They make a stem and leaf plot...
Curated OER
Probability Using M&M's
Students estimate and then count the number of each color of M&M's in their bag. In this mathematics lesson, students find the experimental probability of selecting each color from the bag. Students create pictographs and bar graphs...
EngageNY
Types of Statistical Studies
All data is not created equal. Scholars examine the different types of studies and learn about the importance of randomization. They explore the meaning of causation and when it can be applied to data.
Curated OER
Quarter, Nickel, Dime....
An engaging game called, "Quarter, Nickel, and Dime" is presented in this math lesson. Players are given an envelope with slips of paper that represent the three coins. In pairs, they play the game 18 times, and the whole class charts...
Curated OER
Fire!, Probability, and Chaos
Learners explore the concept of probability. In this probability lesson, students simulate a controlled forest burn using an applet. Learners vary the probability of trees burning and predict what will happen.
Curated OER
Basic Probability
Learners explore basic probability. In this Algebra II/Geometry lesson, students use modeling to solve basic probability problems involving real-life applications.
Curated OER
Probability
Students investigate probability. In this fourth through sixth grade mathematics lesson, students collect, organize and display data in an appropriate chart or graph as they calculate and apply basic probability.
Curated OER
Investigating the Probability
Learners investigate probability using coins and dice. They collect data, graph, organize and interpret data. They predict, describe, compare, compute and draw conclusions based on what they observe and record.
EngageNY
Events and Venn Diagrams
Time for statistics and learning to overlap! Learners examine Venn Diagrams as a means to organize data. They then use the diagrams to calculate simple and compound probabilities.
Curated OER
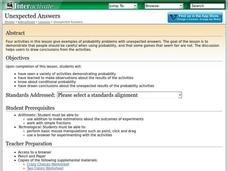
Unexpected Answers
Students explore the concept of fairness. In this fairness lesson, students play four probability games. Students determine who has the best chance of winning each of the four games. Students discuss which games gave an unfair advantage.
Other popular searches
- Probablity Math Lessons
- Probability Math Lessons
- Math Lessons Probabilities
- Math Lessons/ Probability
- Math Lessons on Probability


