Curated OER
Moles Lab Activities
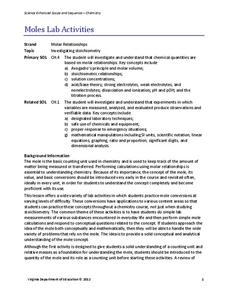
General chemistry class members engage in a mini-unit on mole conversions. Through nine lab activites with varying degrees of difficulty, they practice measuring mass and volume, molar calculations, and stoichiometry. Terrific...
Curated OER
Why Doesn't SSA Work?
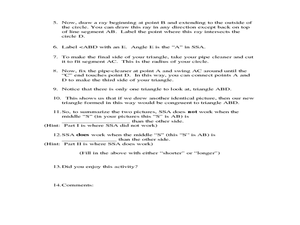
Students investigate the relationship between angles and their sides. In this geometry lesson, students prove why SSA does not work as a true angle side relationship theorem.
Curated OER
El Nino and Its Effects
Students research El Nino and its effects all over North America using Web Resources. Working in teams, they present their findings. They look for connections and relationships between animal behavior and climate.
Curated OER
Forces Cause Change
Third graders will gain recognition that physical relationships affect each other and that change occurs when one object acts upon another.The teacher will recognize ways in which technology can be used to enhance the understanding of...
Curated OER
Sink or Float?
Students investigate whether different objects sink or float in water using the Scientific Method. They listen to the book "Christopher Columbus" by Stephen Krensky, identify the steps of the Scientific Method, conduct the sink or float...
Curated OER
Dissecting the Cube
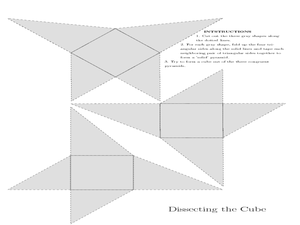
Students investigate the volume of cones. In this geometry lesson, students define the formula to find the volume of cones. They define the concept of having to dissect a three dimensional figure and find the volume.
Curated OER
Distance Formula
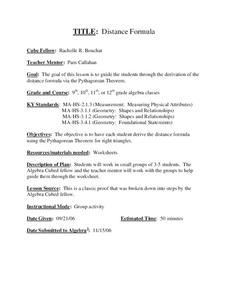
Students calculate the distance between two points using the distance formula. In this geometry lesson, students derive the distance formula using the Pythagorean Theorem.
Curated OER
Anything I Can Do You Can Do Better
Students complete a two-week unit involving design and construction concepts. They watch a PowerPoint presentation about geometric shapes, draw the fourteen shapes incorporated in bridge construction, and in small groups design, build,...
Curated OER
Polly and the Shapeshifter
Young scholars analyze the patterns in polygons and relate it to the rate of change. In this algebra instructional activity, students discuss the relationship between the data and the graph of the data.
Curated OER
The Window Problem
Students identify patterns and compute formulas to solve the problems. In this algebra lesson, students come up with a rule given a pattern, and analyze the relationship between data and graphs.
Curated OER
The Tangent Ratio
Students calculate the tangent ratio given a right triangle. In this trigonometry lesson, students use a right triangle and the Pythagorean Theorem to solve problems.
Curated OER
Which Triangles are Right
Students apply properties of right triangles to solve problems. In this geometry lesson plan, students identify axioms and theorems using examples.
Curated OER
Origami Cube
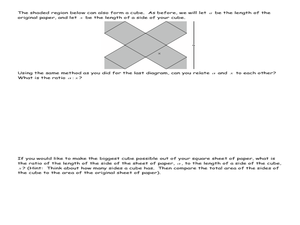
Students compare two lengths using the area of a square. In this geometry instructional activity, students solve problems using ratio and proportion of the two shapes. They solve equations by taking the square root of both sides.
Curated OER
JFK Assassination
Learners write equations of a line. In this algebra lesson, students investigate the assassination of JFK through linear equations. They calculate the length of given line segments.
Curated OER
Analyzing Graphs and Data
Students collect and analyze data. In this statistics lesson, students graph their data and make inferences from the collected data. They display their data using graphs, bar graphs, circles graphs and Venn diagrams.
