Curated OER
Excel Lesson
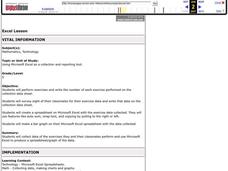
Fifth graders will perform exercises and write the number of each exercise performed on the collection data sheet. They survey eight of their classmates for their exercise data and write that data on the collection data sheet. They then...
Curated OER
Creating Circle Graphs with Microsoft Excel
Students create graphs of circles. In this geometry lesson, students use Microsoft Excel to create graphs. They construct the graphs using paper and pencil as well as the computer.
Curated OER
Excel Lesson
Young scholars investigate Microsoft excel. In this technology lesson, students create formulas using excel and apply these formulas to solve relative, absolute and mixed reference cells. They perform immediate and delayed calculations.
Curated OER
Conversation Heart Graphing
Sixth graders review the different types of graphs (bar, line, pictograph) They predict the data set they can garner several boxes of conversation hearts. Students record their data using an Excel spreadsheet. They create a graph based...
Curated OER
Basic Algebra and Computers: Spreadsheets, Charts, and Simple Line Graphs
Young scholars, while in the computer lab, assess how to use Microsoft Excel as a "graphing calculator." They view visual representations of line graphs in a Cartesian plane while incorporating basic skills for using Excel productively.
Curated OER
Data Lesson Vital Information
Students prepare and collect data and use excel and create a graph. They collect data about the number of pattern blocks that are put on tables. Students then record that data in Excel.
Curated OER
How Big Is Your Head?
Students explore measurement by measuring classmates' heads. They record their measurements and they put the measurements in order from smallest to largest. Students figure the mean, median, mode, maximum, minimum, and range of their...
Curated OER
Fish and Clips
Youngsters test magnetic strength by measuring the mass of paper clips that they "hook" with a magnet. Your first and second graders should love the hands-on activities associated with this plan. The reproducible materials are quite good...
Curated OER
Using Spreadsheets and Graphs
Third graders explore mathematics by utilizing computers. In this graphing lesson, 3rd graders gather class data based on a particular topic such as the "favorite candy" of the class. Students utilize this information and computers to...
Curated OER
Data Displays with Excel
Students collect and analyze data. In this statistics instructional activity, students display their data using excel. They plot the data on a coordinate plane and draw conclusion from their data.
Curated OER
Daily Time Ratios
Students track and record how much time they spend on each activity. In this spreadsheet instructional activity, students apply different functions using Microsoft excel to format cells and calculate the sum of their total time spent...
Curated OER
kind of Bean
Third graders sort different types of beans and collect the data. They create a data table, put the information on the data table and then graph their results. They answer follow-up questions.
Curated OER
Traffic Problem- Solved Using Microsoft Excel
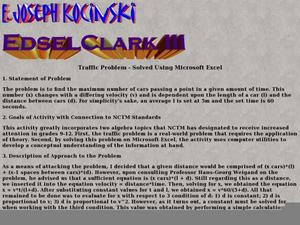
Students relate algebra to real life scenario. In this algebra lesson, students design a plan to help traffic flow smoothly using velocity and speed. This assignment is done using Microsoft Excel.
Curated OER
Tracking Your Favorite Web Sites
Ninth graders track the hit count on their favorite web sites. In this Algebra I lesson, 9th graders record the number of hits on their favorite web site for twenty days. Students explore the data to determine if the relation defines a...
Curated OER
It's In The Chocolate Chips
Students investigate which brand of chocolate chip cookies contains the most chocolate. They analyze and compare data using Microsoft Word and Microsoft Excel. They communicate the results with Microsoft PowerPoint.
Curated OER
Introducing Tessellations
Students create tessellations to increase their knowledge of the applications of geometry. They explore the different shapes of polygons.
Teach Engineering
Air Pollution in the Pacific Northwest
Scholars investigate levels of nitrogen dioxide in the Pacific Northwest by examining the role of nitrogen in air pollution and how remote sensing can be used to measure nitrogen levels. An Excel spreadsheet calculates the difference...
Curated OER
Peopling the New World -- An Archaeological Exercise in Excel
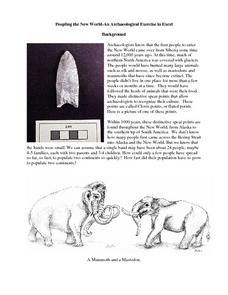
Young scholars examine different types of spears that have been discovered from various civilizations. In groups, they calculate the answers to various word problems and enter their information on a spreadsheet. They use the data in...
Curated OER
Using Imported Data in Excel
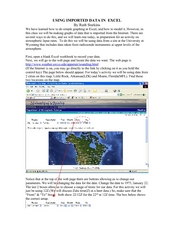
Students import atmospheric data from the internet. In this earth science lesson, students graph the data they collected. They complete the worksheet after the activity.
Curated OER
Using Averages to Create Graphs Through Excel
Sixth graders create and use a spreadsheet to make graphs which will be used to analyze Progress Report and Final Report Card grades. They practice finding the mean, median, mode, and range of a data set. Students also incorporate column...
Curated OER
What's Your Shoe Size? Linear Regression with MS Excel
Learners collect and analyze data. For this statistics lesson, pupils create a liner model of their data and analyze it using central tendencies. They find the linear regression using a spreadsheet.
Curated OER
Graph Related Linear Inequalities
High schoolers explore the concept of linear inequalities. In this linear inequality lesson, students graph linear inequalities using Microsoft Excel.
Curated OER
Ict Activity 22
Learners use Excel to solve quadratic equations by trial and improvement. They enter formulas and try different solutions to improve their solutions more quickly. Afterwards, they report the solutions to different levels of accuracy.
Curated OER
Create and Analyze Rectangular Patterns
Students explore the concept of geometric patterns. In this geometric pattern lesson plan, students use Microsoft Excel to explore geometric patterns. Students analyze growth rates of pattern growth. Students create their own...
Other popular searches
- Microsoft Excel Spreadsheets
- Microsoft Excel Lessons
- Microsoft Excel 2003
- Microsoft Excel Projects
- Beginning Microsoft Excel
- Microsoft Excel Lesson Plans
- Microsoft Excel Formulas
- Microsoft Excel Navigation
- Microsoft Excel Basics
- Microsoft Excel 2007
- Microsoft Office Excel 2007
- Microsoft Excel 2003 Lessons


