Curated OER
da Vinci: Body Proportion Theories
Middle schoolers investigate the validity of da Vinci's proportion theory by recording human measurements on scatter plots. In groups of three, they record each other's height and wingspan to create a Powerpoint presentation, chart, or...
Curated OER
"Spooktacular Patterns" - A Math Unit for October
Students extend a pattern using everyday objects. They use sound and objects to make a pattern
Curated OER
Is the System Fair?
Students investigate shapes and patterns. In this algebra lesson, students move from concrete to abstract understanding of shapes and concepts. They use variable to identify the unknown.
Curated OER
Anything I Can Do You Can Do Better
Students complete a two-week unit involving design and construction concepts. They watch a PowerPoint presentation about geometric shapes, draw the fourteen shapes incorporated in bridge construction, and in small groups design, build,...
Curated OER
Statistical Process Control
Students brainstorm items they have that use memory and view Statistical Process Control PowerPoint presentation. They complete Statistical Process Control Simulation/experiment then find the average, range and standard deviation in...
Curated OER
What is It? Susie Sees!
Students explore the five senses. In this cross curriculum five senses instructional activity, students view an "I Can See Colors" PowerPoint presentation and sort items by color and shape. Students mix primary color paints to...
NOAA
Tracking a Drifter
Be shore to use this drifter resource. The third installment of a five-part series has learners using the NOAA's Adopt-a-Drifter website to track to movement of a drifter (buoy) in the ocean. Graphing the collected data on a map allows...
Curated OER
Dream! (Part One)
Students share with the class what they want to be when they grow up. As a class, they identify what they want to be for Halloween as well. They are videotaped stating their dream and photographed with their mask. Using the masks, they...
Curated OER
Search and Rescue Project
Students create a search and rescue party. In this geometry lesson, students simulate a rescue operation using math. They calculate the time, rate and solve word problems related to the real world.
Curated OER
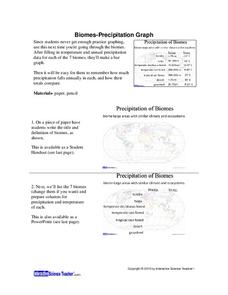
Biomes: Precipitation Graph
Students practice graphing by studying biomes. In this precipitation lesson, students graph the precipitation patterns for the 7 biomes on Earth. Students view a PowerPoint presentation in class which explores the 7 biomes...
Curated OER
Factoring Trinomials
Students factor trinomials. In this algebra lesson, students use special patterns and formulas to factor. They utilize algebra tiles as a hands-on method for gaining practice with trinomials.
Curated OER
Multiplying Binomials
Students factor binomials and apply it. In this algebra lesson plan, students use patterns to factor difference of squares and FOIL to factor other binomials. They apply the concept of binomials to vertical multiplication.
Curated OER
Exploring Quadratic Equations
Eleventh graders explore quadratic equations. In this Algebra II lesson, 11th graders use Geometer’s Sketchpad to explore the properties of quadratics and the connections with polynomials and linear equations. The lesson is...
Curated OER
Polluting the Environment
Fourth graders construct mini-ecosystem, pollute the ecosystem, observe, collect, and record data on the effects of these pollutants on their ecosystem, organize data on spreadsheets, create graphs, and design presentations to share with...
Curated OER
Using Excel to Reference and Graph Live Data from a Web Site
Students collect live buoy data about water temperatures in the Gulf of Mexico from the Internet and work individually to organize their data and create a line graph using Excel Spreadsheet. Students analyze their data and examine any...
Curated OER
Bias in Statistics
Students work to develop surveys and collect data. They display the data using circle graphs, histograms, box and whisker plots, and scatter plots. Students use multimedia tools to develop a visual presentation to display their data.
Curated OER
Playground Zoom
Students observe and draw small objects on the playground or in the classroom with and without a magnifying glass. They explore how lenses can affect the way that an object is observed from afar or remotely sensed. Afterwards, they share...
Curated OER
Divisibility Book
Students create a notebook with divisibility rules in it. In this algebra lesson plan, students write down the rules that determine the factors of a number. They continue to add to the book and use it to help them on their problems.
Curated OER
Matrix Operations
Students solve problems using matrices. In this algebra lesson, students add, subtract and multiply matrices. They use the graphing calculator to simplify and graph linear equations.
Curated OER
Strongest Polygon
Students define and identify shapes by name. In this geometry lesson, students construct, identify and compare polygons based on the number of sides. They classify each shape based on their angle sum theorem.
Curated OER
Linkages Between Surface Temperature And Tropospheric Ozone
Students organize and analyze data regarding changes in tropospheric ozone and then hypothesize about the consequences of these changes.
Curated OER
A Worm World
Students maintain a compost bin and build a worm observatory. They design experiments relating to worms and record observations in a worm journal.


