Bowland
Mystery Tours – Plan Your Tour
Everyone loves a vacation and a set of three activities has groups planning a tour of the U.K. using given distance, time, and price data. They solve a variety of problems related to the trip and produce a report on the success of the trip.
Curated OER
Do You Want To Learn more Aobut QC Planning Tools?
Students explore scientific graphs and charts. They describe the origin of power curves and examine QC procedures. Students calculate critical-size errors that are medically important. They read OPSpecs charts. Students describe the...
Curated OER
Wiggle Worms
First graders investigate worms, collect and analyze data. In this worm and data lesson, 1st graders listen to Chick and Duckling from the Macmillan/McGraw-Hill reading series. They conduct experiments with worms, collect simple data,...
Curated OER
Ladybugs
Third graders keep and report records of investigations and observations of ladybugs utilizing tools like journals, charts, graphs and computers. They discover and study the life cycle of ladybugs and complete a KWL chart about ladybugs.
Curated OER
The Sun Affects Earth
Third graders read, write, and listen to information about the sun and its effects on the Earth.as it relates to its axis, orbit, rotate, and revolution. In this solar system instructional activity, 3rd graders examine how the sun...
Curated OER
How Do We Use Scientific Inquiry To Solve the World's Problems?
Ninth graders examine how a scientific investigation is performed. They read and discuss examples of various scientific experiments, design an experiment involving fast growing plants, and create graphs and charts to present their...
Curated OER
A Child's Journey through Medicine
Students experience a variety of activities that relate to human physiology and their functions. They create graphs and charts after testing their heart rates and blood pressure They conduct a survey of the student body and create ...
Curated OER
Daily Weather Calendar
Third graders use the internet to record the daily weather conditions. Using symbols, they take the information they gathered and create an easy to read chart. They share their charts with the class to end the lesson.
Curated OER
Wetlands: Pave or Save?
Students discuss the characteristics of wetlands and how to make them more productive. Using a map, they locate the major wetlands in the United States and color them using a key. They read an article and in groups answer discussion...
Curated OER
What is the Population Distribution of Cartoon Characters Living On the Pages of Your Newspaper?
Students read various cartoons in their local newspaper and calculate the population demographics, spatial distribution and grouping of the characters. Using this information, they create a population distribution map and share them with...
Curated OER
Have Respect
Pupils learn the value of respect. For this Clifford the Big Red Dog lesson plan, students read the story, discuss respect, and experience a mini-international festival.
Curated OER
What's Going to Happen at Any Given Barometer Reading?
Fourth graders brainstorm a list of words associated with weather. In groups, they sort the words into categories and observe the weather in their area for a month. To end the lesson, they compare the barometer measurements for a...
Curated OER
Using Non-Text Features
Second graders examine graphs and charts from their local newspaper. As a class, they discuss what the data means and how it relates to the article. In groups, they are shown two sets of graphs or charts and they practice explaining...
Curated OER
Weather
Students participate in a variety of mini-lessons including experiments, literature readings, physical education components, music, data gathering and recording and more to expose them to several themes of weather; i.e. water cycle,...
Curated OER
Butterflies
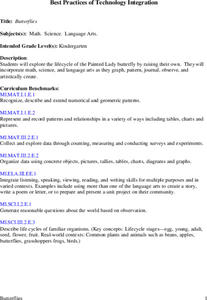
Students will explore the life cycle of the Painted Lady butterfly by raising their own. They will incorporate math, science, and language arts as they graph, pattern, journal, observe, and artistically create.
Curated OER
That Was Then, This Is Now
Students examine the price of food over time. They analyze charts, perform math operations and compare and contrast data about the price of food. They complete worksheets while interperting the charts.
Curated OER
Discovering the Oregon Trail
Students explore U.S. history by researching the Oregon Trail. In this American exploration instructional activity, students read the story On the Shore of the River and define the exact path early settlers took to find the state of...
Curated OER
Roles of the President
Students read a document which explains the roles and responsibilities of the President of the United States. In groups, they tour the George Bush Presidential Museum and participate in a Presidential scavenger hunt. Once back in the...
Curated OER
Cancer: A Crisis of the Cells
Pupils analyze cancer data represented in graphs and charts. They describe the changes in cell structure and function as the result of cancer. They also examine phenomenas that are believed to cause cancer.
Curated OER
One, Two, Three...and They're Off
Students make origami frogs to race. After the race they measure the distance raced, collect the data, enter it into a chart. They then find the mean, median, and mode of the data. Next, students enter this data into Excel at which time...
Curated OER
And the Winner Is...
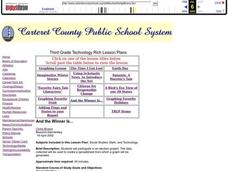
Third graders participate in an election project. They collect data to create a spreadsheet from which a graph is generated.
Curated OER
Bug Hunt
Students strengthen observational skills by searching for insects in their home and classroom. In this observation lesson, students use magnifying glasses to classify what kinds of bugs were found. Students then create a bar graph to...
Curated OER
Geography: World Dynamics
Students discuss and examine how the world is changing. After reading an article, they discover the immediate changes that have taken place and how they have effected living things. They complete a worksheet identifying the changes as...
Curated OER
The Role and Influence of Salem's Merchants in Building Salem's Wealth and Expanding the East Indies Trade Through an Examination of Elias Hasket Derby
Fifth graders examine the role of Salem's merchants. Using the live of Elias Hasket Derby, they identify how he helped open up Salem's ports to the world and how it helped America grow as a country. Reading primary source documents, they...


