Curated OER
Linear Regression and Correlation
Learners explore scatter plots. In this linear regression instructional activity, groups of pupils graph scatter plots and then find the line of best fit. They identify outliers and explain the correlation. Each group summarizes and...
CK-12 Foundation
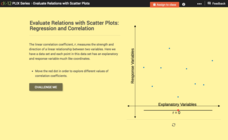
Evaluate Relations with Scatter Plots: Regression and Correlation
Introduce the concept of a correlation coefficient using an interactive lesson. Learners begin by manipulating a correlation coefficient and watching a graph change to represent the new value. Questions help strengthen their...
Kenan Fellows
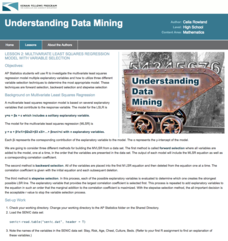
Multivariate Least Squares Regression Model with Variable Selection
The risk of contracting an infection in the hospital is low, but it does happen. Learn what risk factors have the highest correlation with hospital-acquired infections in the final lesson of a three-part series. Using the open source R...
Curated OER
What's Your Shoe Size? Linear Regression with MS Excel
Learners collect and analyze data. In this statistics lesson, pupils create a liner model of their data and analyze it using central tendencies. They find the linear regression using a spreadsheet.
Mathalicious
Pic Me!
Finally! Math and Instagram have come together to discuss the correlation between likes and followers. High schoolers can't help but want to discover what makes one account more popular than another by developing a line of best fit and...
Statistics Education Web
NFL Quarterback Salaries
Use statistics to decide if NFL quarterbacks earn their salaries! Learners study correlation coefficients after using technology to calculate regression equations. Through the data, they learn the meaning of correlation and correlation...
Statistics Education Web
The United States of Obesity
Mississippi has both the highest obesity and poverty rate in the US. Does the rest of the data show a correlation between the poverty and obesity rate in a state? Learners tackle this question as they practice their skills of regression....
Statistics Education Web
Text Messaging is Time Consuming! What Gives?
The more you text, the less you study. Have classes test this hypothesis or another question related to text messages. Using real data, learners use technology to create a scatter plot and calculate a regression line. They create a dot...
Kenan Fellows
Lego Thinking and Building
Run a simulated airplane manufacturing plant with your pupils as the builders! Learners build Lego airplane models and collect data on the rate of production, comparing the number produced to the number defective. Using linear...
Curated OER
Linear and Exponential Models
High schoolers investigate the differences between linear and exponential models. In this linear and exponential models activity, students make a table of given data. High schoolers determine if the data is linear or...
Curated OER
Curve Fitting
Pupils investigate linear, quadratic, and exponential regressions. They plot sets of data points, determine the regression equation that best fits the data and lastly investigate the coefficient of determination.
Curated OER
Linear and Exponential Models
Students linearize data to determine if an exponential model is suitable. In this linearizing data to determine if an exponential model is suitable lesson, students graph the residuals of sets of data that appear to have an exponential...
Curated OER
Line of Best Fit
Students explore the concept of linear regression. In this linear regression lesson, students do a Barbie bungee activity where they collect linear data. Students plot their data using a scatter plot. Students determine a line of best...
Curated OER
Linear and Quadratic Model, Data Modeling
Students model quadratic and linear equations. In this algebra instructional activity, students solve word problems using equations. They create scatter plots and make predictions using correlations.
Curated OER
Regressive Music
Student use the Ti calculator to graph sinusoidal graphs. In this calculus lesson plan, students use the CBL to collect and analyze data of sinusoidal graphs. They manipulate their collected data and make predictions.
Kenan Fellows
How Does an Unhealthy Diet Influence our Health and Well-Being?
You are what you eat, or so they say! After surveying family and friends on a week of eating habits, learners analyze the data for patterns. They compare different variables such as fats and cost, fats and calories, or fats and LDLs.
Curated OER
Line of Best Fit
Students identify the line of best fit. In this statistics lesson plan, students collect and analyze data. They calculate the regression equations and identify the different types of correlation.
Curated OER
Means of Growth
High schoolers collect and graph data. In this statistics instructional activity, students analyze their plotted data using a scatter plot. They identify lines as having positive, negative or no correlation.
Curated OER
Matchstick Math: Using Manipulatives to Model Linear, Quadratic, and Exponential Functions
Playing with matches (unlit, of course) becomes an engaging learning experience in this fun instructional unit. Teach pupils how to apply properties of exponential functions to solve problems. They differentiate between quadratic and...
Curated OER
Price of Apples- Linear Data
Students collect data and create a graph. In this algebra lesson, students describe functions graphically, algebraically and verbally. They identify functions as being independent and dependent using variables.
Curated OER
M&M Exponential Activity
Students create a scatter plot of their experimental data. In this algebra lesson, students use M&M's to determine an algebraic model. They discuss results in class.
Curated OER
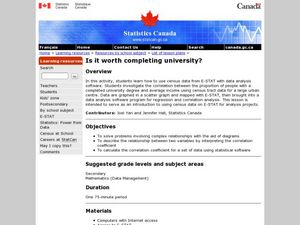
Completing University
Students analyze the pros and cons of completing a 4 year school. In this statistics lesson plan, students complete surveys and use E-STAT to graph their data. They learn to plot and build diagrams.


