Curated OER
NUMB3RS - Season 2 - "Convergence" - Air Hockey
Learn how to use a matrix to organize data to solve a problem. This activity uses wins and losses to rank players for an air hockey tournament they wish to have. After practicing some basic matrix operations the class could do the...
Curated OER
ROV Grid Search
Pupils perform activities to recreate the exploration of the sea bottom. They attach magnets to the bottom of the remote controlled car to see how many camouflaged objects it can pick up. As a class, students examine the results of...
Curated OER
Math: Collecting and Analyzing Date
Children count how many of an activity they can do in a row, such as ball tossing and record the date and count. Children track over a period of time and graph results.
Curated OER
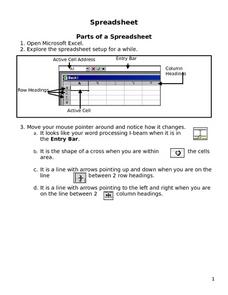
Parts of a Spreadsheet
Students create their own spreadsheet. They identify the different parts that make up a spreadsheet and organize their data. They practice using functions and formats.
Illustrative Mathematics
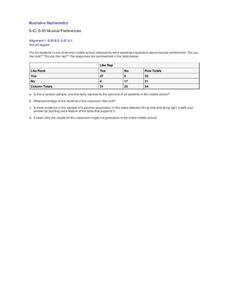
Musical Preferences
If you like rap music, are you more likely to like rock music? Use statistical analysis to determine if there is a positive association between rap and rock in this particular sample. While the problem is relatively simple, the...
Curated OER
Patterns in the Multiplication Table
Explore patterns in the multiplication table in order to deepen your third graders' understanding of this essential skill. Implement this activity as a whole-class lesson, allowing students to work in pairs or small groups to support...
Curated OER
M & Ms in a Bag
Students make predictions about the number and colors of M&M's in a snack size package. They create an Excel spreadsheet to record the data from their small group's bag, create a graph of the data, and discuss the variations of data...
Curated OER
What Goes Around
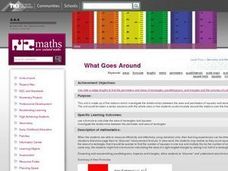
Fourth graders investigate the relationships between the area and perimeters of squares and rectangles. They calculate the perimeter of rectangles and squares using a formula. Students investigate the relationship between the perimeter...
Curated OER
Apple Graphing
Do you like apples? Create a taste test for your first and second grade learners. Cut red, green, and yellow apples, and have learners select their favorite. After tasting all of the apples, they collect data and graph the results with...
Curated OER
Parts of a Spreadsheet
Students experiment with the basic functions of a spreadsheet. They practice using headers, footers, functions and fonts. They also organize information.
Curated OER
Where's the Period in the Periodic Tables?
Students investigate the Periodic Table of Elements. The teacher is provided with the necessary background information to complete the lesson. Students practice matching the element symbol to its place on the chart.
Curated OER
Growing Rock Candy
Students observe the growth of rock candy. In this crystal growth lesson, students make rock candy and measure the crystal growth over five days.
Curated OER
DASH Sunrise and Sunset/ Seasons Chart
Second graders rotate as the person to enter the information of sunrise and sunset into a spreadsheet. The teacher also demonstrates how to convert the spreadsheet into a chart.
Curated OER
Weights and Measures
Students master the gathering, averaging and graphing of data. They practice conversion to metric measures. They gain fluency in the use of technology tools for math operations.


