Curated OER
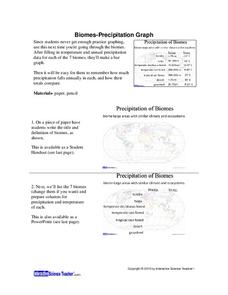
Biomes: Precipitation Graph
Students practice graphing by studying biomes. In this precipitation instructional activity, students graph the precipitation patterns for the 7 biomes on Earth. Students view a PowerPoint presentation in class which explores the 7...
Curated OER
Using Charts and Graphs to Study East Asia's Modern Economy
Students examine East Asia's modern economy. In groups, classmates use the internet to compare the resources, products, and economy of specified countries. After collecting the data, pupils create charts, tables and graphs. They...
Curated OER
So Fast! So Slow!
Fifth graders give examples of objects that move slow and fast. In this physics lesson, 5th graders rank animals according to how quickly they move. They create a bar graph of organisms versus rates of speed.
Curated OER
Graphing Favorite Colors
Third graders collect data and insert it into ClarisWorks to create a spreadsheet/graph of their favorite color. They interpret the data together.
Curated OER
Graphing a Healthy Lifestyle
Fifth graders, over a week, record the amount of time they spend sleeping, attending school, watching T.V., exercising and doing homework. At the end of the week the students graph all of their information and discuss how sleep impacts...
Curated OER
Groups Coming to America
Fifth graders use text or other references to locate different types of information about the Mayflower and pilgrims. They create a presentation for lower elementary classes about the Pilgrims.
Curated OER
Wolves
Students explore wolves. In this ecology and wolves lesson, students research predator-prey relationships on the Internet and complete a related worksheet with a partner. Students interpret data on bar graphs to determine growth and...
Curated OER
Livelihood of the Times
Students recognize the importance of analyzing historical information and data. In this historical analysis lesson, students collect information for a bar graph, complete a jobs worksheet and define vocabulary.
Curated OER
Force and Gliders
Students explore physics by creating data graphs in class. For this flight properties lesson, students read the book Flying Machine and identify the force, resistance and construction necessary to keep a glider in the air. Students...
It's About Time
Volcanic Hazards: Airborne Debris
Pupils interpret maps and graph data related to volcanic ash. Then they analyze the importance of wind speed and the dangers of the ash to both life, air temperature, and technology.
Curated OER
Preventing Forest Fires (Elementary)
Students complete activities to learn about the importance of fire prevention and protecting the diversity of the forest. In this forest protection lesson plan, students discuss forest fires and work in groups to research the species...
Curated OER
Body Measuring Activity
Students explore geometry by participating in a measurement activity. In this human anatomy lesson, students identify the appropriate methods to measure human body parts and do so in class. Students create a bar graph from their class...
Curated OER
Snow Cover By Latitude
Young scholars create graphs comparing the amount of snow cover along selected latitudes using data sets from a NASA website. They create a spreadsheet and a bar graph on the computer, and analyze the data.
Curated OER
Weather Report Chart
Students complete a weather report chart after studying weather patterns for a period of time. In this weather report instructional activity, students measure temperature, precipitation, cloud cover, wind speed, and wind direction for a...
Curated OER
By Golly, By Gum
Learners investigate the ingredients and creation of chewing gum. In this scientific method lesson, students make predictions about what will happen to the mass of a piece of gum as it is chewed by a human. Learners graph the data from...
Curated OER
Lunchroom Trash
Students explore the amount of waste produced by humans. For this ecology lesson, students predict which lunch bag and its contents will produce the most waste. Leftover material is examined, amounts are recorded, and a bar graph is...
Curated OER
Enhancing Writing Through Technology
Students participate in a class survey of their favorite activity to do in the snow and organize the results in a graph. They write a paragraph about the graph using language from a class-developed word web and include both an opening...
Curated OER
Other kinds of groups- part 4 of 5
Students compare and contrast characteristics of groups. Students create graphs using various symbols of different groups. Students make maps of their neighborhood 'groups'.
Curated OER
Studies of the Eastern Worlds: Population Graphing
Seventh graders participate in several learning/research stations in which they view artwork from various countries of the Eastern world and collect information on the populations of the Eastern countries. They then use this information...
Curated OER
The Meatrix: Do You Want the Truth? Factory Farm vs. Family Farm
Students examine the differences between family farms and factory farms. They practice using different math computations and reading graphs and tables. They work together in groups to research the differences between the farms and make a...
Curated OER
A Nation of Nations Lesson Plan: Charting African Ethnicities in America
Students read a portion of the narrative, The Transatlantic Slave Trade, to explain the ethnic origins of enslaved Africans brought to the US. They create charts and bar graphs comparing ethnicities in the lowlands and tidewater regions.
Curated OER
Environmental Risk Analysis
High schoolers complete a survey and enter the responses in a spreadsheet. The spread sheet is used to create a bar graph. Students complete spreadsheets listing types of hazards in their community.
Curated OER
A Fishy Tale
Eighth graders do a research project on a particular species of Atlantic seafood and record and graph information pertaining to commercial landings of that species of seafood. They use a website and an Appleworks spreadsheet.
Curated OER
Slavery: Population Growth in Arkansas
Eighth graders examine the number of slaves in Arkansas in each census period from 1820 to 1860. They graph the data using the proper labeling and write a paragraph summarizing the data from each period making comparisons between slave...
Other popular searches
- Skittles Bar Graph
- Double Bar Graphs
- Bar Graphs Pictographs
- Histogram and Bar Graph
- Bar Graphs and Histograms
- Bar Graph Problem Solving
- Favorite Food Bar Graph
- Bar Graphs Histograms
- Interpreting Bar Graphs
- Bar Graphs for Birthdays
- Bar Graph Worksheet
- Bar Graphs and Charts


