Curated OER
Computer Graphing Calculator Explorations
Students explore the graphing calculator feature on the Macintosh computer to explore some "parent" functions and their translations, combinations, and composites.
Curated OER
Exploring Renewable Energy Through Graphs and Statistics
Ninth graders identify different sources of renewable and nonrenewable energy. In this math lesson, learners calculate their own carbon footprint based on the carbon dioxide they create daily. They use statistics to analyze data on power...
Curated OER
Simple Inequalities
Students solve inequalities. In this inequalities lesson, students evaluate simple inequalities. They examine vocabulary words. Students participate in breath holding activities and write inequalities to represent the activity. In teams,...
Curated OER
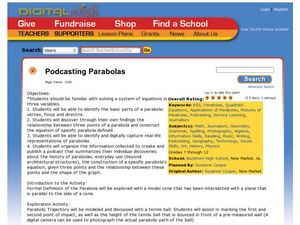
Podcasting Parabolas
Students explore parabolas. For this algebra and technology lesson, students construct the equation of a specific parabola, then take digital photos of real-life representations of these parabolas. Students create a podcast...
Curated OER
Using Excel To Teach Probability And Graphing
Students engage in the use of technology to investigate the mathematical concepts of probability and graphing. They use the skills of predicting an outcome to come up with reasonable possibilities. Students also practice using a...
Curated OER
Tech Algebra: A Statistics Study
Students use the internet to gather a minimum of thirty pieces of data. Students create box and whisker graphs, and stem and leaf plots from the information. They calculate mean, median, mode, and range. Students write a summary and...
Curated OER
Exploring Quadratic Equations
By stretching and translating the parabola given and determining the effects on the equation, young scholars explore finding the vertex and zeros of a parabola and relate them to the equation. Students also view the intercept form to...
Curated OER
Baseball Statistics
Students take an in depth examine baseball record breakers. They calculate statistics, not just for one year, but over whole careers, to compare some famous players and find who was the best all-time home run hitter.
Curated OER
Linear Progression
Students use graphing calculators to graph lines and create tables of values. They perform an experiment using M&M's and slinkys, then create their tables based on their results.
Curated OER
Univariate Data Analysis
Learners use given data to compare baseball players. They create box and whisker plots to compare the players and determine which they feel is the best player. Students use calculators to make box and whisker plots. They write paragraphs...
Curated OER
Planning My Vacation Online
Students use a variety of resources to decide on a vacation destination. They locate three points of interest, a hotel, and two restaurants at their destination.Students obtain driving directions for their trip, create a trip budget, and...
Curated OER
Newton's Third Law and Aircraft Propulsion
Students research propulsion, graph data, and interpret the results.
Curated OER
Water Quality Data Analysis
Students develop a process for analyzing collected bayou data.
They find the mathematical relationships among various biological factors.
Students, work collaboratively using technology in their data analysis.
Curated OER
Will the Leaning Tower Fall?
Young scholars research the Tower of Pisa and write a report about its history. They examine the physics of why it leans and whether it might fall. Students plan a trip to Italy to view the Tower. They develop an itinerary and budget for...
Curated OER
Gold Rush California and its Diverse Population
Students compare contemporary cultural differences with historical differences based on population percentage. In this cross-curriculum Gold Rush/math lesson, students analyze aspects of California's Gold Rush population and diversity...
Curated OER
Math On the Job
Investigate different types of math required for specific jobs. For this math in occupations lesson, use the Internet to research what type of math one might need to know in order to be successful in different jobs. Complete a...
Curated OER
What Can I Afford?
Students explore the costs of various cell phone plans, and various types of banking accounts to determine which one would yield the highest returns if the money saved from the cell phones were placed in different accounts.
Curated OER
Population Pyramids
Students utilize population pyramids to answer questions, make comparisons, draw conclusions and support predictions about the populations of China, India and the Unites States. They arrange numbers and symbolic information from various...
Curated OER
Modeling Population Growth
Students investigate the reasons for taking a census and determine the problems that are involved in the process. They examine the population figure for Montana and Lake county before using the information to complete the included...


