Curated OER
Energy Audit
Students collect data about energy usage and use mathematical calculations to analyze their data. In this energy conservation and statistics math lesson plan, students survey their homes to complete an energy usage worksheet. Students...
Curated OER
Indy 500
Start your engines! Small groups collect data from websites pertaining to the Indianapolis 500 in order to determine average speed per lap and miles in each lap. The instructional activity requires prior knowledge of the the formula d=rt.
Curated OER
Create a Public Opinion Survey: The Middle East in the News
Though the discrete content here is a pair of New York Times articles about a 1998 military strike on Iraq and the coincident impeachment by the House of Representatives of then-President Clinton, this detailed plan for creating,...
Curated OER
Technology - Data Collection
Pupils collect and analyze data from the United States Census Bureau. Using spreadsheet technology, students explore their results and make preductions about income groups. Pupils compute the mean, median and mode. They create charts...
Curated OER
Mean, Median and Mode
Students explore websites and the included PowerPoint presentation to gain a better understanding of mean, median and mode. A weather worksheet is included for in-class work and assessment.
Curated OER
Comparing Data
Eighth graders create a survey, gather data and describe the data using measures of central tendency (mean, median and mode) and spread (range, quartiles, and interquartile range). Students use these measures to interpret, compare and...
Curated OER
Global Warming Statistics
Students research and collect data regarding temperature changes for a specific location and find the mean, median, and mode for their data. In this climate change lesson, students choose a location to research and collect data regarding...
Curated OER
Create Your Own Form
Students gather and organize data using a mock census form, and determine mean, mode, range, and median for sets of data.
Curated OER
Dealing With Data
Students collect, organize, and display data using a bar graph, line graph, pie graph, or picture graph. They write a summary describing the data represented and compare the graph to another graph in the class.
Curated OER
Mean and Median
Learners define mean and median. In this "average" lesson, students calculate the mean and median for a list of given numbers.
Curated OER
Misleading Graphs
Students explore number relationships by participating in a data collection activity. In this statistics lesson, students participate in a role-play activitiy in which they own a scrap material storefront that must replenish its...
Curated OER
Observing the Evidence
Fifth graders explore how to do research from a large group. They explore how to choose a representative sample and collect data from it.
Curated OER
Holly Leaves
Sixth graders analyze mathematics by participating in a botany activity. In this holly lesson, 6th graders identify if all holly leaves have the same amount of prickles by conducting a math survey. Students analyze many leaves and...
Curated OER
Sports Teams & Math
Learners collect sports data, keep track of wiins, losses and scores and average the teams' scores.
Curated OER
Makiing Sense of the Census
Students investigate trends in agriculture. In this secondary mathematics lesson, students evaluate agricultural census data from 1982 to 2202 as they compare the properties of the mean and the median. Students explore what...
Curated OER
Technology vs. Nontechnology
Fourth graders determine the range, mean, median and mode using a computer spreadsheet. An identical set of calculations is done without using a computer. The results of each method are compared. They calculate the mode, median and range...
Curated OER
Statistics Newscast in Math Class
Young scholars study sports teams, gather data about the teams, and create a newscast about their data. For this sports analysis lesson, students research two teams and define their statistical data. Young scholars compare the two teams,...
Curated OER
Slopes, Hopes, & Speed
Students investigate the sport of skiing through Internet research in this multi-task lesson. They compare and generalize the results of five individuals by using mean, median, and mode.
Curated OER
TE Activity: A Tornado in My State?
Students study data about tornadoes in the United States while completing a worksheet. They develop a bar graph showing the number of tornadoes for the top ten states in the US. They find the median and mode of the data set.
Curated OER
Then and Now
Students conduct research and use census data to compare different times and places. In this census instructional activity, students interpret data from charts and graphs, comparing census information from two time periods as well as...
Curated OER
Harry Potter Research Project
Students work together to complete a research project on Harry Potter. They write a research question and develop a survey to give to their classmates. Using the results, they create a graph and draw conclusions about the data collected.
Curated OER
Tech Algebra: A Statistics Study
Students use the internet to gather a minimum of thirty pieces of data. Students create box and whisker graphs, and stem and leaf plots from the information. They calculate mean, median, mode, and range. Students write a summary and...
Curated OER
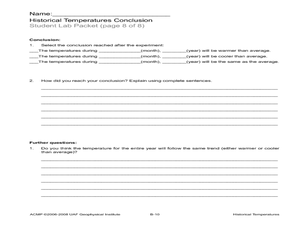
Historical Temperatures
Students research historical regional temperatures for their current season. In this historical weather lesson, students conduct weather station and Internet research to learn about historical regional temperatures. Students collect and...
Curated OER
Prom Date
Pupils use the internet to research the cost of going to the school prom. As a class, they brainstorm about the things needed in order to go to the dance and use advertisements to make a budget. After all of the data is collected, they...

