Curated OER
Sweet Data
Students input data about the colors of their serving of M&M candies onto a spreadsheet. They create charts and graphs based on this information.
Curated OER
What's Data?
Students get the opportunity to investigate the concept of data collecting. They explore how to tally and read a bar graph. Vocabulary about data is also be included. At the end of the lesson, individual students collect data independently.
Curated OER
The Numbers Tell the Story
Students demonstrate how to gather and interpret statistical data. In this data analysis instructional activity, students search for statistics on the health effects of smoking and place the information into charts. Students create these...
Museum of Tolerance
Why is This True?
Are wages based on race? On gender? Class members research wages for workers according to race and gender, create graphs and charts of their data, and compute differences by percentages. They then share their findings with adults and...
Curated OER
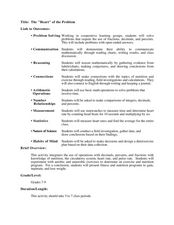
The "Heart" of the Problem
Students explore mathematical operations while studying nutrition. In this physical fitness lesson, students explore calories, pulse rate, and the circulatory system. Students use mathematical data to create a healthy physical fitness...
Curated OER
Math: Football Fever Fun
Students compile statistics from high school or other football team and construct a spreadsheet on which to record their findings. Using Chart Wizard to analyze the data, they construct charts and graphs for a visual display of the...
Curated OER
Where Should We Put a Store?
Students analyze population data. They convert population data into simple density maps to help make decisions about their world. They select the best location for a school store based on population density. They present their maps...
Curated OER
Asthma Survey
Young scholars collect survey data on the prevalence of asthma in a community. They summarize and display the survey data in ways that show meaning.
Curated OER
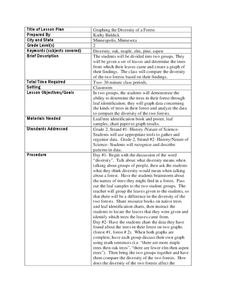
Graphing the Diversity of a Forest
Second graders work in groups to identify what types of trees create which types of leaves In this plant life lesson plan, 2nd graders analyze a set of leaves and identify the tree it came from while graphing the data in a science...
Curated OER
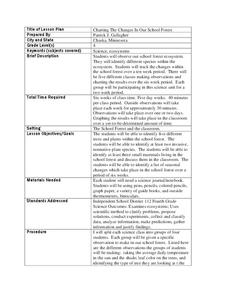
Charting the Changes in Our School Forest
Fourth graders investigate the ecosystem and how forests are disappearing. In this environmental protection lesson, 4th graders analyze the changes in their school for 2 weeks. Students practice identifying trees, birds, and...
Curated OER
Science and Technology
Students research inventions that have been created. In this historical technology lesson, students read the Harcourt Brace social studies textbook and discuss how inventors used graphs to display data. Students create a table to write...
Curated OER
Using Charts and Graphs to Study East Asia's Modern Economy
Students examine East Asia's modern economy. In groups, classmates use the internet to compare the resources, products, and economy of specified countries. After collecting the data, pupils create charts, tables and graphs. They...
Curated OER
MAISA and the REMC Association of Michigan
Students complete online research to study geography's impact on weather. In this geography and weather lesson, students research weather in their city for ten days using an online website. Students bookmark the site, enter data into a...
Curated OER
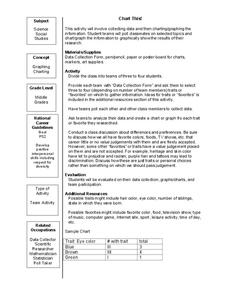
Chart This!
Students collect data and graph or chart the information. For this data organization lesson, students poll their classmates about certain topics and chart or graph the information to show the results of their research.
Curated OER
Weather Patterns and Severe Weather Planning
Students document weather patterns associated with the region where they live. They collect weather data about severe thunderstorms, hurricanes, and tornadoes, and create safety preparation charts for each.
Curated OER
EXCEL It!
Young scholars surf the Web gathering information about graphs. The data collected is incorporated into an Excel spreadsheet and graphs of varying nature generated to further enhance student understanding.
Curated OER
Using Excel To Teach Probability And Graphing
Students engage in the use of technology to investigate the mathematical concepts of probability and graphing. They use the skills of predicting an outcome to come up with reasonable possibilities. Students also practice using a...
Curated OER
Who Represents You?
Learners investigate Congress and how individuals are represented in this Country. In this government activity, students complete worksheets research government web sites to determine which senators and congressmen represent them....
Curated OER
Harry Potter Research Project
Students work together to complete a research project on Harry Potter. They write a research question and develop a survey to give to their classmates. Using the results, they create a graph and draw conclusions about the data collected.
Curated OER
What's Your Favorite Color?
Students investigate the psychology behind color choices using two sites on the Internet. They complete a worksheet and construct an Inspiration file with the data from the charts. Then they form a hypothesis and test it using the...
Curated OER
Fabulous Fossils
Seventh graders investigate how fossils are formed and discuss how scientists determine the appearance of ancient plants and animals. They make fossils of everyday objects for others to identify. They make spreadsheets to display fossil...
Curated OER
Mapping Possible Solutions
Fourth graders propose possible sites for the heart of Florida state capital by mapping collected data onto a Florida state map and recording data in a Travel Log.
Curated OER
Different Perspectives of Oregon's Forest Economic Geography
Pupils map data on employment in wood products manufacturing in Oregon counties. In this Oregon forest activity, students discover the percentage of people employed in the forest manufacturing industry. Pupils create a box and whisker...
Curated OER
Where In the World Are We?
Fifth graders read postcards and find their locations on maps. They use the pictures and text on the postcards to write about imaginary vacations. They compute the mileage and compare it to TripMaker data.


