Curated OER
Student News And Weather Channel
Fabulous! Your 5th graders should love this project. As an ongoing lesson throughout the year students use temperature probes to record outside temperature and then document their data using spreadsheets. They use their weather data and...
National Wildlife Federation
The Tide is High, but I’m Holding On… Using ICESat Data to Investigate Sea Level Rise
Based on the rate of melting observed from 2003-2007 in Greenland, it would take less than 10 minutes to fill the Dallas Cowboys' Stadium. The 17th lesson in a series of 21 has scholars use the ICESat data to understand the ice mass...
Montana State University
What's the Weather?
How many jackets do you need to stay warm and climb Mount Everest? An informatie resource covers the topic of Mount Everest, the resource helps young scientists discover the difference between climate and weather. Activities include...
National Wildlife Federation
Get Your Techno On
Desert regions are hotter for multiple reasons; the lack of vegetation causes the sun's heat to go straight into the surface and the lack of moisture means none of the heat is being transferred into evaporation. This concept, and other...
NASA
Geographical Influences
"If global warming is real, why is it so cold?" Distinguishing the difference between weather and climate is important when it comes to understanding our planet. In these activities, young scientists look at the climate patterns in a...
Curated OER
Graphing and Analyzing Biome Data
Students explore biome data. In this world geography and weather data analysis lesson, students record data about weather conditions in North Carolina, Las Vegas, and Brazil. Students convert Fahrenheit degrees to Celsius degrees and use...
National Wildlife Federation
Wherefore Art Thou, Albedo?
In the sixth lesson in a series of 21, scholars use NASA data to graph and interpret albedo seasonally and over the course of multiple years. This allows learners to compare albedo trends to changes in sea ice with connections to the...
Curated OER
Weather's Outer Limits
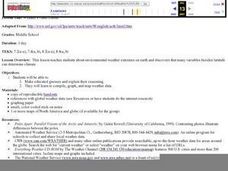
Students make educated guesses and explain their reasoning and compile, graph, and map weather data. They then study environmental weather extremes on earth and discover that many variables determine climate.
Curated OER
Current Weather
A great year around activity that shows young mathematicians how the math skills they are learning are actually used in the real world. This exercise also helps learners begin to distinguish the difference between weather and climate. As...
NOAA
Understanding El Niño Using Data in the Classroom
Are weather troubles caused by El Nino? An installment of a larger series presents a five-part lesson on El Nino. First, scholars learn to read sea surface temperature maps. Then, they compare them to data on graphs before determining if...
Curated OER
Weather Report Chart
Students complete a weather report chart after studying weather patterns for a period of time. In this weather report instructional activity, students measure temperature, precipitation, cloud cover, wind speed, and wind direction for a...
Curated OER
The Weather Around Us
First graders explore weather patterns. In this weather activity, 1st graders research the daily weather by creating a graph of the daily weather conditions. Students use the computer to access information regarding the weather forecast....
Curated OER
"Weather Watch"
Students investigate components of weather and the climate in areas around the country. They analyze data from the University of Michigan weather website, complete a weather watch worksheet, and graph weather data.
Curated OER
Graphing the Facts
Middle schoolers investigate the correlation between our planet's weather and solar activity. They analyze and discuss data regarding the solar activity cycle, graph annual precipitation and temperature averages over a period of 100...
Curated OER
Weather, Sea Level Rise and Climate Change
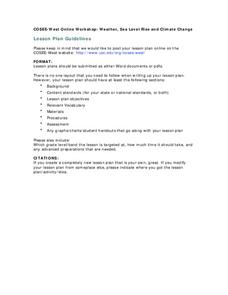
Eighth graders compare and contrast weather and climate. In this earth science lesson, 8th graders research weather data site and analyze historical data. They present their findings in class and explain identifiable trends.
Curated OER
The Mitten
Explore the Ukraine through a reading of The Mitten. Readers will determine the sequence of events, cause and effect, make predictions, and find the main idea of the story. They also use math skills to make charts and graphs. Finally,...
Curated OER
Investigation 7 - Interpreting Weather Data
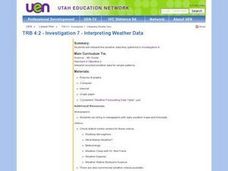
Fourth graders interpret the weather data they gathered in Investigation 6. They take an average of each component in each season. They compare the same components of each season and write the differences they see between the seasons.
Curated OER
Comparing Temperatures and Latitudes
Eighth graders collect weather data from a variety of cities at the same latitudes, but on different continents. They organize data using spreadsheet program, generate graphs, and incorporate into a word processing document. Students...
Curated OER
Graphing Changes in Weather
Students graph current temperature and weather conditions for three days. In this weather lesson plan, students go to the Weather Channel's website and look up weather for their zip code then graph the conditions and record the...
Curated OER
Weather the Storm
Fourth graders complete multi-curricular activities for weather. For this weather lesson, 4th graders complete creative writing, research, and weather data analysis activities for the lesson.
Chicago Botanic Garden
Climate Change Around the World
It is unknown if cloud cover increases in response to carbon dioxide levels changing, helping climate change slow down, or if cloud cover decreases, allowing Earth to warm faster. Part four in the series of five lessons has classes...
Curated OER
Using My Nasa Data To Determine Volcanic Activity
Students use NASA satellite data of optical depth as a tool to determine volcanic activity on Reunion Island during 2000-2001. They access the data and utilize Excel to create a graph that has optical depth as a function of time for the...
Curated OER
Weather "Whys" Lesson 4: Spring
Students explore the attributes of spring. In this weather lesson, students collect data regarding weather from various media. Students graph simple weather data and dress animals for forecasted weather. Students discuss the...
Curated OER
Water Cycle, Weather, and Climate
Eighth graders investigate the water cycle and its processes. They examine temperature and precipiation data to classify climate of ten cities. They then create a climate map of the world.


