Curated OER
Involving Community Members, Parents, and Community Agencies in Student Learning
Students predict and estimate the number of moose shot by people between the years of 1986-1990. They analyze data and statistics, construct bar graphs, and conduct research on the Alaskan moose.
Curated OER
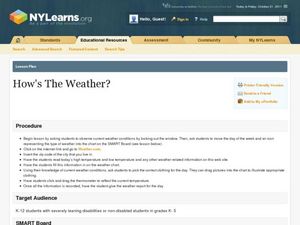
How's the Weather
"How's the Weather?" is an exercise that combines science and math as students graph the weather along the Iditarod Trail. They complete a double-line graph of the weather of a chosen checkpoint over the course of one week. Students...
Curated OER
Linear Progression
Students use graphing calculators to graph lines and create tables of values. They perform an experiment using M&M's and slinkys, then create their tables based on their results.
Curated OER
Those Amazing Seaworld Animals
Students research the animals at SeaWorld and then relate the info they have found into various types of graphs; line, circle and bar. This instructional activity combines math and science nicely. They access a website imbedded in this...
Curated OER
Story Pyramids
Young writers generate descriptive words. They use pictures of various landscapes (from books, magazines, or the Internet) and complete a story pyramid. The pyramid (included here) asks to describe the main character, the setting, and...
Curated OER
CCC: Credible sources, Creative Commons Images, and Citing Your Sources
As part of a unit devoted to the study of autobiographies, this one-day library session focuses on developing research skills. Class members locate and properly cite a sketch of a Creative Commons image, as well as record the call...
Curated OER
Driving Forces Forestry In Canada
Students discuss the natural and economic impact of forests and forestry. Using given statistics they construct different types of graphs in which they make observations and draw conclusions.
Curated OER
Download and Analyze
Students download information from a NASA website into a database. They transfer it to a spreadsheet by completing the information and analyze the information. They determine temperature averages, mode, and graph the results. They write...
Curated OER
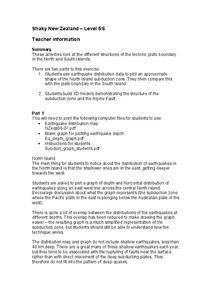
Shaky New Zealand
Students explore Earth science by building a model in class. In this tectonic plate lesson, students identify the impact tectonic shifts have on humans and animals and where the plates and faults lie under New Zealand. Students examine...
Curated OER
The Best Friend of Charleston, The Charleston Railroad
Third graders explore the Charleston Railroad. In this South Carolina history lesson, 3rd graders examine the impact of the rail line on economy and citizens of the state. Students create posters to advertising the railroad line that...
Curated OER
Measuring Rainfall and Relationships Between pH, Alkalinity and Suspended Solids in the Pago River
Eleventh graders test the pH and alkalinity of Pago River. In this ecology lesson, 11th graders collect data and use spreadsheet to graph results. They analyze and share their findings with the class.
Curated OER
So Fast! So Slow!
Fifth graders give examples of objects that move slow and fast. In this physics instructional activity, 5th graders rank animals according to how quickly they move. They create a bar graph of organisms versus rates of speed.
Curated OER
Front Page News
Students write original earthquake articles typically found on the front page of a newspaper. Each student has the freedom to write in a variety of writing styles (lead story, human interest story, editorials, etc.). They research...
Curated OER
Positive Future Fair Project
Ninth graders view the film "Pay It Forward" and discuss what kind of public campaign is needed to move people to positive action. They consider different ways of presenting information (graphs, visual displays, etc.) as tools for...
Curated OER
Statistics Newscast in Math Class
Students study sports teams, gather data about the teams, and create a newscast about their data. In this sports analysis instructional activity, students research two teams and define their statistical data. Students compare the two...
Curated OER
Preventing Forest Fires (Elementary)
Learners complete activities to learn about the importance of fire prevention and protecting the diversity of the forest. In this forest protection activity, students discuss forest fires and work in groups to research the species count...
Curated OER
Butterflies in the Garden
Learners estimate the population of a butterfly ecosystem and create a chart and graph based on information they find.
Curated OER
Using a spreadsheet and the Internet to learn about stock market performance
Students record the progress weekly of a business of their choice on the stock market, graph those results, research and report on current news and how it pertains to the companies recent performance.
Curated OER
Graphing the Past Using Today's Technology
Eighth graders research and gather information from such sources as Microsoft Encarta, World Wide Web sites, and other sources using computer software to collect data.
Curated OER
Snow Cover By Latitude
Students create graphs comparing the amount of snow cover along selected latitudes using data sets from a NASA website. They create a spreadsheet and a bar graph on the computer, and analyze the data.
Curated OER
Baseball - America's Pastime
Students complete Internet research about baseball and baseball players. They complete a variety of activities including writing an epitaph for Jackie Robinson, a news article about him, and make graphs displaying salaries of a number of...
Curated OER
Linear Equations Project Fram
Students engage in a lesson that focuses on the concept of linear equations. They practice solving problems with a variety of problems and graphing the solution set for each. Students write a summary paragraph about two methods of...
Curated OER
Math: Will The Airplane Get Off the Ground?
Students use data from real-life models to calculate and compare the force required for an airplane of a given weight to become airborne. They use a graphing calculator to evaluate data and use the World Wide Web to access data.
Curated OER
Integration and the "Barrier Breakers": Black Baseball 1945-1960
High schoolers explore integration of Major League Baseball, identify important individual baseball players who played key roles in integration, and analyze historical information through charts, graphs, and statistics.
Other popular searches
- Line Graphs
- Double Line Graphs
- Bar and Line Graphs
- Line Pie Bar Graph
- Interpreting Line Graphs
- Line Plot Graphs
- Making Line Graphs
- Reading Line Graphs
- Analyzing Line Graphs
- Creating Line Graphs
- Number Line Graphs
- Reading Double Line Graphs


