Curated OER
A Picture's Worth 1000 Words: Decoding Intercultural Symbols
Students interpret a set of pictographs, defining what each image means and create their own set of symbols as an alphabet. They then write using their own symbolic alphabet using pictures.
Curated OER
Survey Says...
Young learners create and implement a school-wide survey about student body favorites! Learners record and analyze the data on a bar graph, picture graph, and line graph, and then display the data. Then, wrap it all up with a celebration...
Curated OER
Comparing School Bus Stats
Engage in a lesson plan that is about the use of statistics to examine the number of school buses used in particular states. They perform the research and record the data on the appropriate type of graph. Then they solve related word...
Curated OER
Rock art
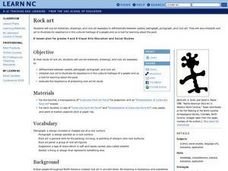
Students study rock art they use art materials, colored photographs and rock art examples to: differentiate between symbol, petroglyph, pictograph, and rock art. They interpret rock art to illustrate its importance in the cultural...
Curated OER
Dealing With Data
Learners collect, organize, and display data using a bar graph, line graph, pie graph, or picture graph. They write a summary describing the data represented and compare the graph to another graph in the class.
Curated OER
A Walk in the Woods: The Legacy of the Haudenosaunee
Fourth graders explore folktales and legends to investigate the life and culture of the Haudenosaunee Indians. The stories and food of the six Nations are experienced as the instructional activity proceeds.
Curated OER
Lesson PlanThe Huexotzinco Codex
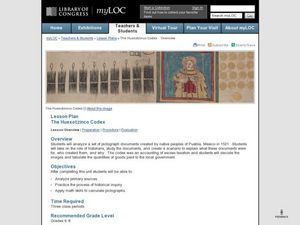
Students examine primary sources that include pictographs from Puebla, Mexico. For this Huexotzinco Codex lesson, students perform historical analysis as they investigate the codex as they make inferences and draw conclusions about taxes...
Curated OER
History in Pictures
Sixth graders interpret diary entries, letters and read maps to better understand portions of history. They create an oral presentation demonstrating understanding of how cultural characteristics have been communicated through art,...
Curated OER
Using Charts and Graphs to Study East Asia's Modern Economy
Students examine East Asia's modern economy. In groups, classmates use the internet to compare the resources, products, and economy of specified countries. After collecting the data, pupils create charts, tables and graphs. They...
Curated OER
The First American Colonies
Fourth graders are introduced to the early colonial settlements of America by observing a map, filling in a map themselves and then researching information on their own.
Curated OER
What's Data?
Learners get the opportunity to investigate the concept of data collecting. They explore how to tally and read a bar graph. Vocabulary about data is also be included. At the end of the lesson, individual students collect data independently.
Curated OER
History In Pictures
Sixth graders explore Lewis and Clark's expeditions. In this Lewis and Clark lesson, 6th graders view the routes they took and discuss how the territory has changed. Students make a timeline of their journey. Students research online for...
Curated OER
Does One Tree a Forest Make?
Students take a walk around the schoolyard looking at and identifying the trees. One leaf for each tree is collected. A chart is developed that represents the population of trees on the school ground. They keep journals and write an essay.
Curated OER
Download and Analyze
Students download information from a NASA website into a database. They transfer it to a spreadsheet by completing the information and analyze the information. They determine temperature averages, mode, and graph the results. They write...
Curated OER
Graphing
Students investigate graphing. In this bar graph lesson, students view an informational website about graphing, then construct a class birthday bar graph outside with sidewalk chalk. Students choose a survey topic, then collect data and...
Curated OER
"Dreaming of Success" Unit
Students recognize the importance of planning for the future. They think about and project themselves into the future. Students become aware that everyone encounters challenges in life and that they can be met and obstacles can be...
Curated OER
Around the World
Students explore ways people from around the world are like them. They discuss how geography affects the way people live and work and how culture affects a person's day to day life. Students give a presentation over a chosen country to...
Curated OER
Weather Report Chart
Learners complete a weather report chart after studying weather patterns for a period of time. In this weather report lesson, students measure temperature, precipitation, cloud cover, wind speed, and wind direction for a month. Learners...
Curated OER
Home on the Biome
Fifth graders study six major biomes, graph temperature and rainfall, and present their findings to the class.


