Pennsylvania Department of Education
Equal Groups
Students explore statistics by completing a graphing activity. In this data analysis instructional activity, students define a list of mathematical vocabulary terms before unpacking a box of raisins. Students utilize the raisins to plot...
Curated OER
Graphing Scatterplots
Students examine scatterplots and determine the equation of a line using the slope-intercept method. Students interpret graphs, draw inferences, and sketch a curve of best fit for the graph. Based upon patterns in the graphs, students...
Curated OER
Comparison of Two Different Gender Sports Teams - Part 3 of 3 Scatter Plots and Lines of Best Fit
Young scholars create a scatter plot for bivariate data and find the trend line to describe the correlation for the sports teams. In this scatter plot instructional activity, students analyze data, make predictions,and use...
Curated OER
Get the Picture with Graphs
Fifth graders examine line, bar and circle graphs in the newspaper and on the Internet. They complete sketches of graphs with an emphasis on selecting the best model to depict the data collected.
Curated OER
Misleading Graphs
Students explore number relationships by participating in a data collection activity. In this statistics instructional activity, students participate in a role-play activitiy in which they own a scrap material storefront that must...
Curated OER
Statistics Newscast in Math Class
Learners study sports teams, gather data about the teams, and create a newscast about their data. In this sports analysis lesson, students research two teams and define their statistical data. Learners compare the two teams, make...
Curated OER
A Colony is Born : Lessons 7 - 10 What's My Line?
Fifth graders research their assigned regions, complete regional guide and prepare presentations about the New World colonists. They refer to "Everyday LIfe: Colonial Times" as well as searching marked internet sites.
Curated OER
Science and Technology
Students research inventions that have been created. In this historical technology lesson, students read the Harcourt Brace social studies textbook and discuss how inventors used graphs to display data. Students create a table to write...
Curated OER
Ornithology and Real World Science
Double click that mouse because you just found an amazing instructional activity! This cross-curricular Ornithology instructional activity incorporates literature, writing, reading informational text, data collection, scientific inquiry,...
Curated OER
Linkages Between Surface Temperature And Tropospheric Ozone
Students collect and interpret data to make predictions about the levels of ozone in the atmosphere. Using the internet to collect data students use their collected data to create a line graph for analysis. Students make mathematical...
Curated OER
Theobroma - Food of the Gods
Students discuss the history of cacao and its use in the production of chocolate. They analyze actual cacao pods and record their observations. Finally they create a five minute contour drawing of the cacao pod and seeds.
Curated OER
Predicting Temperature: An Internet/Excel Learning Experience
Third graders use the Internet (www.weather.com) to find the high temperature for our locale and the high temperature for another city around the world. They keep track of the temperature in these two locations for 10 days.
Curated OER
Weather... Or Not
Students observe and discuss the local weather patterns, researching cloud types and weather patterns for cities on the same latitude on the Internet. They record the data for 6-8 weeks on a graph, and make weather predictions for their...
Curated OER
Confusing Colors!
Fourth graders collect data, graph their data, and then make predictions based upon their findings. They's interest is maintained by the interesting way the data is collected. The data collection experiment is from the psychology work of...
Curated OER
Global Warming Statistics
Students research and collect data regarding temperature changes for a specific location and find the mean, median, and mode for their data. In this climate change lesson, students choose a location to research and collect data regarding...
Curated OER
Temperature and Pressure on Airplane Surfaces
Students use the Internet to delve into the relationship between fores and motion on a sizable object. They predict where they think the temperature and pressure be the greatest, and where the pressure be the lowest.
Curated OER
Chew on This
Eighth graders explore and demonstrate the seven steps of the scientific method. They predict how much sugar is in chewing gum and test, analyze, and calculate the sugar content of gum.
Curated OER
Martian Sun Times
Students become weather reporters for the Martian Sun Times newspaper to gather. interpret, and compare current weather information for Mas and Earth. Final articles be posted on-line. There are seven investigations in this unit.
Curated OER
Math: Will The Airplane Get Off the Ground?
Learners use data from real-life models to calculate and compare the force required for an airplane of a given weight to become airborne. They use a graphing calculator to evaluate data and use the World Wide Web to access data.
Curated OER
Student Weather Journal
Students recognize different types of cloud patterns and associate these patterns with certain types of weather. They predict the weather for the next 6 to 24 hours. They then improve their observation skills as they check on the weather...
Curated OER
Using 3-D Models for Code Validation with FoilSim
High schoolers use FoilSim to complete the activity to create tables of data sets comparing the lift values for a 3-D model of a symmetrical wing section to the values predicted by the FoilSim software.
Curated OER
Good Health Care
Students work in collaborative groups researching topics such as nutrition, the benefits of exercise on the body, dental and personal hygiene. They conduct interviews, create charts and posters, and report their results with a written...
Curated OER
Climate Change
Students compare weather data and draw conclusions. For this climate change lesson plan, students determine whether data collected over a period of ninety years shows a warming trend.
Curated OER
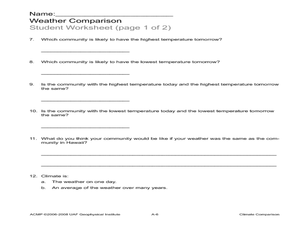
Climate Comparison
Students explore climate regions. In this climate lesson, students examine the climate regions of Alaska as well as the state of Hawaii. Students research selected Internet sources to gather information regarding the climates present in...


