Curated OER
Sweet Data
Students input data about the colors of their serving of M&M candies onto a spreadsheet. They create charts and graphs based on this information.
Curated OER
Cutting Expenses
Learners explore budgeting. In this finance and math lesson, students brainstorm ways in which households could save money. Learners view websites that give cost reducing ideas. Students complete an expense comparison chart and use the...
Curated OER
What's Data?
Students get the opportunity to investigate the concept of data collecting. They explore how to tally and read a bar graph. Vocabulary about data is also be included. At the end of the lesson, individual students collect data independently.
Curated OER
Graphing and Analyzing Biome Data
Students explore biome data. In this world geography and weather data analysis lesson, students record data about weather conditions in North Carolina, Las Vegas, and Brazil. Students convert Fahrenheit degrees to Celsius degrees and use...
Curated OER
Comparing School Bus Stats
Engage in a lesson plan that is about the use of statistics to examine the number of school buses used in particular states. They perform the research and record the data on the appropriate type of graph. Then they solve related word...
Curated OER
First Class First? Using Data to Explore the Tragedy of the Titanic
Students analyze and interpret data related to the crew and passengers of the Titanic. They research information on a Titanic database to illustrate specific statistical conclusions, and whether or not social status affected the outcome.
Curated OER
Math: Football Fever Fun
Students compile statistics from high school or other football team and construct a spreadsheet on which to record their findings. Using Chart Wizard to analyze the data, they construct charts and graphs for a visual display of the...
Curated OER
Create Your Own Form
Students gather and organize data using a mock census form, and determine mean, mode, range, and median for sets of data.
Curated OER
The Numbers Tell the Story
Students demonstrate how to gather and interpret statistical data. In this data analysis instructional activity, students search for statistics on the health effects of smoking and place the information into charts. Students create these...
Curated OER
Survey Says...
Young statisticians collect, organize, and present data to illustrate responses to a survey question. They write and conduct the survey. They finish by presenting the results in the form of a graph.
abcteach
What is Your Favorite Month?
A simple worksheet that helps learners conduct a survey is here for you. In it, pupils collect data on their family and classmate's favorite months. Youngsters use tally marks in the spaces provided to keep track of the answers. Once...
Curated OER
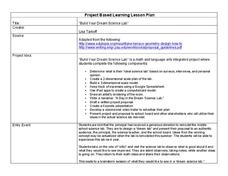
Build Your Dream Science Lab
Would your ideal science lab be filled with bubbling beakers and zapping Tesla coils? Or would it contain state-of-the-art computer technology and data analysis? Dream big with an innovative lesson that connects math and language...
Curated OER
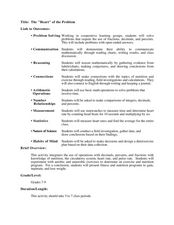
The "Heart" of the Problem
Students explore mathematical operations while studying nutrition. In this physical fitness lesson, students explore calories, pulse rate, and the circulatory system. Students use mathematical data to create a healthy physical fitness...
Curated OER
Graphing in the Information Age
Middle schoolers create a variety of graphs based on population data. In this statistics lesson plan, students use data that can be gathered on-line to make a bar chart, line graph, and circle graph.
Curated OER
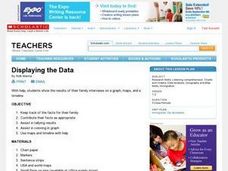
Displaying the Data
Students gather facts about their parent's families through the completion of parent interview forms. Using tally marks, the data gathered is counted, transferred to graphs and used to create family timelines.
Curated OER
Traveling Through Literature
Integrate geography with literature in this interdisciplinary lesson. Begin by reading a poem such as The Time We Climbed Snake Mountain by Leslie Marmon Silko. On a large map, place push pins in the cities or states mentioned. An...
Curated OER
Asthma Survey
Young scholars collect survey data on the prevalence of asthma in a community. They summarize and display the survey data in ways that show meaning.
Curated OER
Arthur Young and the President
Students work with NASS data by converting it into prose. In this historical agriculture information lesson, students read about how George Washington communicated information about crop yields, livestock, and land values. They apply the...
Curated OER
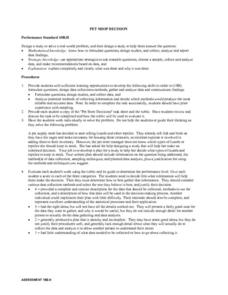
Pet Shop Decision
Students are given the "Pet Store Decisions" task sheet and a rubric that goes with it. Students discuss the task and make a plan for using the rubric sheet to complete the task. Students formulate questions, studies and data collection...
Curated OER
Survey Says...
Young learners create and implement a school-wide survey about student body favorites! Learners record and analyze the data on a bar graph, picture graph, and line graph, and then display the data. Then, wrap it all up with a celebration...
Curated OER
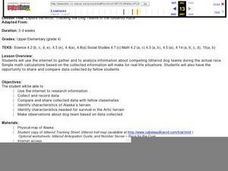
Explore the Arctic: Tracking the Dog Teams in the Ididarod Race
Fourth graders use the Internet to gather and analyze information about competing Iditarod teams during the actual race. They also have the opportunity to share and compare data collected by fellow students.
Curated OER
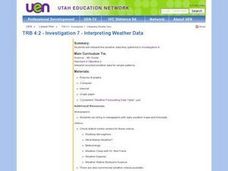
Investigation 7 - Interpreting Weather Data
Fourth graders interpret the weather data they gathered in Investigation 6. They take an average of each component in each season. They compare the same components of each season and write the differences they see between the seasons.
Curated OER
Statistics Newscast in Math Class
Young scholars study sports teams, gather data about the teams, and create a newscast about their data. For this sports analysis lesson, students research two teams and define their statistical data. Young scholars compare the two teams,...
Curated OER
The Solar Cycle
Learners research the solar cycle. In this Science lesson plan, students use the internet to investigate the solar cycle. Learners produce a spreadsheet and graph from the information collected.


