Curated OER
Data Collection
Students write a journal exercise that relates to pets. They collect information from each other in order to practice making and interpreting bar graphs. They Continue building different kinds of graphs with the group.
Curated OER
Survey Says...
Young learners create and implement a school-wide survey about student body favorites! Learners record and analyze the data on a bar graph, picture graph, and line graph, and then display the data. Then, wrap it all up with a celebration...
Curated OER
Graphing
Intended for a faith-based classroom, this lesson requires second graders to create a survey, conduct the survey in multiple classrooms, and graph the results. They can choose between creating a picture or bar graph, or you can require...
Curated OER
What's Data?
Students get the opportunity to investigate the concept of data collecting. They explore how to tally and read a bar graph. Vocabulary about data is also be included. At the end of the instructional activity, individual students collect...
Curated OER
Survey Says...
Young statisticians collect, organize, and present data to illustrate responses to a survey question. They write and conduct the survey. They finish by presenting the results in the form of a graph.
Curated OER
Color Graphs and Poetry
Learners explore color as they create graphs, write poetry, and examine varied interior designs. They respond to writing prompts describing their favorite color. Students collect data and create a bar graph based on a class survey. They...
Curated OER
Misleading Graphs
Students explore number relationships by participating in a data collection activity. In this statistics lesson, students participate in a role-play activitiy in which they own a scrap material storefront that must replenish its stock....
US Department of Commerce
Changes in My State
So much can change in seven years. Young statisticians choose three types of businesses, such as toy stores and amusement parks, and use census data to determine how the number of those businesses in their state changed between 2010 to...
Alabama Learning Exchange
What's Your Favorite Chocolate Bar?
Young scholars complete a math survey. In this math graphs lesson plan, students complete a survey about their favorite candy bars. Young scholars create different kinds of graphs using Microsoft Excel to show their results.
Curated OER
Making Graphs
Learners explore statistics by conducting class demographic surveys. In this graph making lesson, students identify the family members of each classmate, pets they own, and favorite activities. Learners organize their statistics and...
Curated OER
Graphing
Students investigate graphing. In this bar graph lesson, students view an informational website about graphing, then construct a class birthday bar graph outside with sidewalk chalk. Students choose a survey topic, then collect data and...
Curated OER
Fire Safety Survey
Students collect data regarding fire safety and create a graph. Working in small groups, they administer a survey to family and friends regarding their attitudes toward fire safety. After data has been gathered, students graph their...
Curated OER
'The Flood'
Learners hear the story "The Flood," and take a survey of the favorite pet animals in the class. They take the information complied in the survey and make a bar graph to show favorite pet animals using the computer program KidPix.
Curated OER
Taste Test
Third graders practice creating bar graphs by conducting a taste test. In this graphing lesson, 3rd graders taste several different brands of peanut butter and discuss among their classmates which tastes better. Students create a bar...
Curated OER
The Top Ten On-The-Job Skills and Attitudes
Students interview people who have a business and have people working for them. They create a bar graph with the results of their survey. They create a chart with the most important skills or attitudes looked for in a potential employee.
Curated OER
How Tolerant Are Kids in Your School?
Students graph results of a survey about attitudes and tolerance in their school. They discuss the social climate of their school. Students complete a questionnaire, and tabulate the raw data from their class. They create a bar graph...
Curated OER
The Numbers Tell the Story
Students demonstrate how to gather and interpret statistical data. In this data analysis lesson plan, students search for statistics on the health effects of smoking and place the information into charts. Students create these charts...
Curated OER
Jellybean Graphs
Second graders predict and graph data based on the color of jelly beans they think are in a handful. In this prediction lesson plan, 2nd graders will predict how many of each color jellybean are in a handful. Then they graph these...
Curated OER
Students Favorites
Students complete activities using a frequency table and construct a pie graph for the data. In this frequency table lesson plan, students complete a survey to find data for a frequency table. Students use the given link to make a pie...
Curated OER
Bird Bulletins
Students, in groups, create a survey to investigate how much their community knows about birds. They graph their findings using a bar graph. Using the data collected, they develop an advertising campaign to increase community awareness...
Curated OER
Favorite Survey
Fourth graders collect and organize data for charts and bar graphs by questioning their classmates. They utilize a worksheet imbedded in this plan which guides them through their 'favorites' survey.
Curated OER
Environmental Risk Analysis
High schoolers complete a survey and enter the responses in a spreadsheet. The spread sheet is used to create a bar graph. Students complete spreadsheets listing types of hazards in their community.
Curated OER
Enhancing Writing Through Technology
Students participate in a class survey of their favorite activity to do in the snow and organize the results in a graph. They write a paragraph about the graph using language from a class-developed word web and include both an opening...
Curated OER
Whose Breakfast isn't for the Birds?
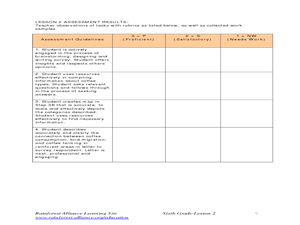
Students explore coffee production. In this cross-curriculum rainforest ecology lesson, students research regions where coffee comes from and investigate how the native birds in the rainforest are effected by coffee production. ...


