EngageNY
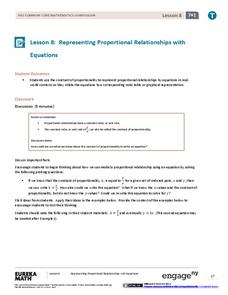
Representing Proportional Relationships with Equations
Use the constant of proportionality to relate the independent variable to the dependent variable. The eighth installment of a 22-part series instructs pupils to use the equation to find the constant of proportionality and then write the...
Creative Learning Exchange
Lesson Plans From The Lorax
When it comes to the environment, no variable is constant. Class members graph behavior over time for the thneeds produced over truffula trees chopped down over the course of Dr. Seuss's The Lorax.
EngageNY
Analyzing Data Collected on Two Variables
Assign an interactive poster activity to assess your class's knowledge and skill concerning data analysis. The teacher reference provides solid questions to ask individuals or groups as they complete their posters.
Radford University
Pizza, Pizza!
Ponder the problem of pizza prices. Pupils use provided information about two different pricing schedules for pizza. They create tables of values and functions to represent the pricing schemes, consider domain restrictions, and identify...
Curated OER
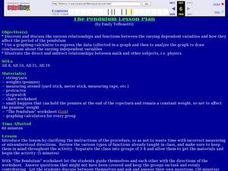
The Pendulum
Students discover and discuss relationships and functions between varying dependent variables and how they affect the period of the pendulum. They use graphing calculator to express the data collected in a graph, to analyze the graph,...
Curated OER
Stochastic and Deterministic Modeling
Explore the difference between stochastic and deterministic modeling through programming. First have the class write algorithms for relatively simple tasks using pseudocode. Use the Python 2.7 program app to simulate Mendel's Pea Pod...
Curated OER
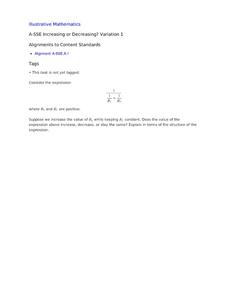
Increasing or Decreasing? Variation 1
Your algebra learners analyze the value of an algebraic expression to decide if it will increase, decrease, or stay the same when one variable is changed as the others stay constant. Their collaborative efforts culminate with a written...
American Statistical Association
Scatter It! (Predict Billy’s Height)
How do doctors predict a child's future height? Scholars use one case study to determine the height of a child two years into the future. They graph the given data, determine the line of best fit, and use that to estimate the height in...
Virginia Department of Education
Quadratic Curve of Best Fit
Class members create a table of the number of chords that can be drawn given the number of points on a circle. Pupils analyze the data created, find a function to fit to it, and use the function to make further predictions.
Curated OER
Making Money and Spreading the Flu!
Paper folding, flu spreading in a school, bacteria growth, and continuously compounded interest all provide excellent models to study exponential functions. This is a comprehensive resource that looks at many different aspects of...
West Contra Costa Unified School District
Introduction to Inverse Functions
Ready to share the beauty of the inverse function with your classes? This algebra II lesson guides the discovery of an inverse function through a numerical, graphical, and an algebraic approach. Connections are made between the three,...
EngageNY
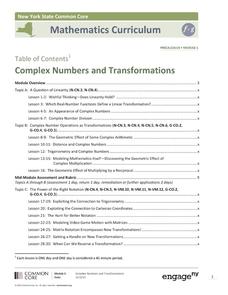
Complex Numbers and Transformations
Your learners combine their knowledge of real and imaginary numbers and matrices in an activity containing thirty lessons, two assessments (mid-module and end module), and their corresponding rubrics. Centered on complex numbers and...
EngageNY
Modeling Relationships with a Line
What linear equation will fit this data, and how close is it? Through discussion and partner work, young mathematicians learn the procedure to determine a regression line in order to make predictions from the data.
Visa
Living On Your Own
Learners gain a realistic understanding of what is required for independent living. They begin by setting up a budget based on needs and lifestyle, and then use worksheets and a presentation to practice such skills as reading a...
Illustrative Mathematics
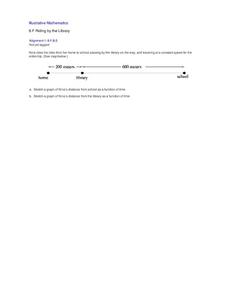
Riding by the Library
Draw a graph that shows the qualitative features of a function that has been described verbally. Make sure learners understand where time is zero and the distance is zero. It may take them some time to understand this concept, so working...
Illustrative Mathematics
High School Graduation
An exercise in finding the approximate time that a name would be called at a graduation. Estimating time may be difficult for some of the class, so this resource would not be a good choice for learning this standard. It does end with a...
Curated OER
Introducing Ideas about Inheritance
Is it nature or nurture? In an easily adaptable kinesthetic activity to introduce genetics, learners group themselves based on a variety of categories. They will quickly find that some characteristics are easy to put in order, while...
Curated OER
Hopper Hunt: IPM Decision-making in Alfalfa
Students describe migrations and life cycle pattersn of a key alfalfa pest, the Porato Leafhopper. They define the Economic Inquiry Level and Economic Threshold. Students evaluate data in relation to profit as it applies to IPM. They...
