Curated OER
Button Bonanza
Collections of data represented in stem and leaf plots are organized by young statisticians as they embark some math engaging activities.
Curated OER
Build A Skittles Graph
Students explore graphing. In this graphing lesson, students sort Skittles candies and use the color groups to create a bar graph. Rubrics and extension activities are provided.
Curated OER
Skittle Graphing (Lesson Plan)
Students discuss the uses of graphs. They use color candies to count and sort before designing graphs. They label the graph papers with appropriate titles and candy colors. They complete the graph bars, and discuss the results with a...
Curated OER
Statistics and Probablility
Statistics and Probability are all about collecting, organizing, and interpreting data. Young learners use previously collected data and construct a picture graph of the data on poster board. This stellar instructional activity should...
Curated OER
Inherited Traits
Young scholars work with a partner to complete an inventory of their traits and compare and discuss their unique qualities. In this biology lesson, students determine percentages for the frequency of observed traits of classmates,...
Missouri Department of Elementary
My Conflict Shield
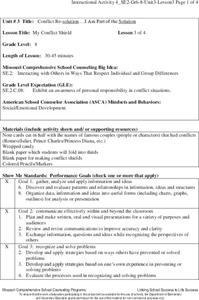
As an exercise in self-awareness and improvement, class members create a Conflict Shield listing 12 skills they believe are the most useful in conflict resolution. They then color the ones they have mastered while leaving uncolored those...
Curated OER
My Conflict Shield
Eighth graders discuss conflict. Working in pairs, they create lists of skills they have used in conflicts, skills they have seen used successfully but not used themselves, and skills they wish to develop. From their lists they identify...


