Illustrative Mathematics
Proportional Relationships, Lines, and Linear Equations
The resource is a good introduction to what makes a proportional relationship between two lines. Discuss the similarities of both lines and the possibility of intersection. Use this opportunity to list other acceptable forms of each...
National Security Agency
Partying with Proportions and Percents
Examine ratios and proportions in several real-world scenarios. Children will calculate unit rates, work with proportions and percentages as they plan a party, purchase produce, and take a tally. This lesson plan recommends five...
EngageNY
Estimating a Population Proportion
Find the percent of middle schoolers who want the ability to freeze time. The 21st installment in a series of 25 has groups collect a random sample of respondents who answer a question about superpowers. Using sample statistics,...
Mathalicious
On Your Mark
With many factors leading to a great athlete, does height make Usain Bolt unfairly fast? Middle schoolers conduct analysis to change the running distance of the Olympic races to be proportional to the height of the participants. They...
EngageNY
Understanding Variability When Estimating a Population Proportion
Estimate the proportion in a population using sampling. The 20th installment in a series of 25 introduces how to determine proportions of categorical data within a population. Groups take random samples from a bag of cubes to determine...
EngageNY
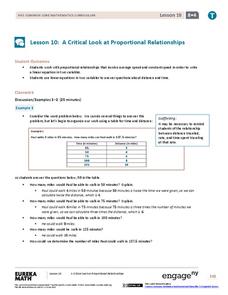
A Critical Look at Proportional Relationships
Use proportions to determine the travel distance in a given amount of time. The 10th installment in a series of 33 uses tables and descriptions to determine a person's constant speed. Using the constant speed, pupils write a linear...
Illustrative Mathematics
Comparing Speeds in Graphs and Equations
Compare two different proportional relationships on a graph. It is up to your mathematicians to determine which of two moving objects have greater speed. A good example of a Common Core multiple choice question.
K20 LEARN
If Our Classroom Were The World: Proportions And Percents
It's a small world after all. Classmates consider world population, languages, and religions in a cross-curricular lesson. Applying percentages and proportions, they determine what the class make-up would be if the class represented the...
Illustrative Mathematics
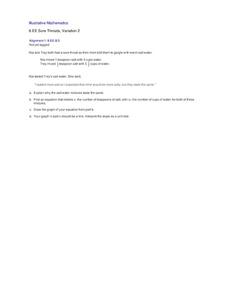
Sore Throats, Variation 2
What does math have to do with a sore throat? When you mix water and salt you have a great review of how to represent proportional relationships by an equation or graph. Here the proportions of the mixtures may be different, but the...
Curated OER
The Foundation of Math and Science
Students uncover the mathematical proportions as well as the history of the Parthenon. In this math and science instructional activity, students use research to find the contributions of ancient Greeks made to our current society. They...
Illustrative Mathematics
Coffee by the Pound
This is a great exercise in graphing proportional quantities to interpret the unit rate as the slope of a graph. It is not easy for learners to understand what a unit rate is. When it is presented as the slope of a linear line graph,...
Illustrative Mathematics
DVD Profits, Variation 1
The idea in the resource is to understand the connections between proportional relationships, lines, and linear equations. To stay within the context of the standard, skip the part of the resource that solves with unit rates. Instead,...
Illustrative Mathematics
Find the Change
This exercise is an opportunity for algebra learners to understand the connection between the slope of a line and points found on the line. Use similar triangles to explain why slope m is the same between any two points. Discuss with the...
Illustrative Mathematics
Peaches and Plums
According to the resource graph, which costs more: peaches or plums? Algebra learners compare two proportional relationships and then throw in a banana. Leaving out the scale helps students become intuitive about graphing.
Curated OER
Dragonfly
The speed of a dragonfly brings math into the real world as your learners collaboratively see the value in calculating unit rates in direct proportion problems. This six-phase lesson encourages you, as the teacher, to only ask questions...
EngageNY
Constant Rates Revisited
Find the faster rate. The resource tasks the class to compare proportional relationships represented in different ways. Pupils find the slope of the proportional relationships to determine the constant rates. They then analyze the rates...
Virginia Department of Education
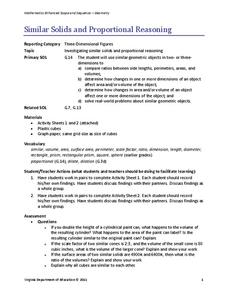
Similar Solids and Proportional Reasoning
Double the dimensions, quadruple the surface area. Pairs build similar prisms and compare the ratios of their surface areas and volumes to the ratio of the heights. Given two similar cones, partners determine the ratios of the lateral...
EngageNY
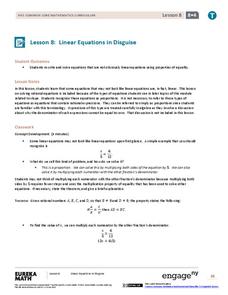
Linear Equations in Disguise
In the eighth segment of a 33-part unit, learners look at equations that do not appear to be linear at first glance. The equations are proportions where the numerators and denominators may have more than one term. To round out the...
EngageNY
Tax, Commissions, Fees, and Other Real-World Percent Problems
Pupils work several real-world problems that use percents in the 11th portion of a 20-part series. The problems contain percents involved with taxes, commissions, discounts, tips, fees, and interest. Scholars use the equations formed for...
Math Can Take You Places
Picture This
Engage scholars in a ratio lesson that employs real-world scenarios. Learners will compare the length and width of pictures and use a table to identify ratio patterns. They watch "Math Can Take You Places" and discuss jobs that use math...
EngageNY
Mixture Problems
What percent of the mixture is juice? Pairs use their knowledge of proportions to determine what percent a mixture is juice given the percent of juice in the components. Pupils use the procedure learned with the juice mixture problem to...
Illustrative Mathematics
Who Has the Best Job?
Making money is important to teenagers. It is up to your apprentices to determine how much two wage earners make with their after school jobs. Participants work with a table, an equation, and a graph and compare the two workers to see...
National Research Center for Career and Technical Education
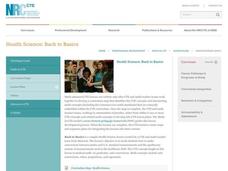
Back to Basics
Your class will enjoy this Health Science lesson created by CTE and math teachers from Missouri. Learners make conversions between the apothecary system and metric and US standard measurements used in the healthcare field. The CTE...
California Academy of Science
Modeling Eclipses with Size and Distance Scales
Size within the solar system is a difficult thing for pupils to imagine. Using everyday objects, they build models to show the scale between the sun, moon, and Earth. They situate their props in proportional distances between the objects...
Other popular searches
- Ratios and Proportions
- Facial Proportions
- Ratios and Proportions Math
- Similar Figures Proportions
- Solving Proportions
- Body Proportions
- Ratio and Proportions
- Ratios Proportions
- Percent Proportions
- Da Vinci Body Proportions
- Da Vinci Facial Proportions
- Rates Ratios and Proportions


