Curated OER
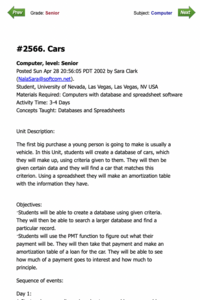
Cars: Math, Research, Economics, Loans
Students investigate what the purchasing of a car entails. They explore car criteria and financing options.
Curated OER
Asthma "Outbreak" Exercise
Students investigate numerical data on a possible asthma epidemic. Using statistical information, students graph and figure ratios of the epidemic. They evaluate the mortality rate from severe smog in the 1950's in London.
Curated OER
Line Of Best Fit: Feet & Forearms
High schoolers actively find the line of best fit. They gather their own data and then use a calculator to find the line of best fit, as well as the equation. They see how to use the TI 81 calculator in order to find the line of best fit.
Curated OER
Glacial Change
Students research the ways in which scientists study glaciers and glacial change. They interpret real time data and calculate the estimated global sea level rise potential. A very good activity to illustrate global warming.
Curated OER
Best Guesser
Fifth graders develop strategies for estimating ages, and illustrate results by graphing and interpreting scatter plots to compare x and y coordinates.
Curated OER
Graphing Pockets
Second graders explore graphing. They count the number of pockets on their clothes and use Microsoft Excel to enter their data. Students create a class graph displaying their findings.
Curated OER
Measures of Spread
Students explore the concept of measures of spread. For this measures of spread lesson, students calculate the standard deviation for a set of data. Students use the standard deviation to analyze and describe the set of data. Students...
Curated OER
Highs and Lows
Students use email to chart weather patterns and then graph their findings. In this weather patterns lesson, students chart their weather for a week at the school. Students then use email to find temperatures at a variety of locations....
Other popular searches
- Spreadsheets
- Excel Spreadsheets
- Budget Spreadsheet
- Favorite Foods Spreadsheet
- Microsoft Excel Spreadsheets
- Candy Wrapper Spreadsheet
- Basic Spreadsheet Skills
- Spreadsheet Lesson Plans
- Meteorology and Spreadsheets
- Using Excel Spreadsheets
- Amusement Park Spreadsheet
- Creating a Spreadsheet


