Curriculum Corner
Coniferous and Deciduous Trees
What are the differences between coniferous and deciduous trees? Supplement your tree lessons with a set of activities that has learners describing, naming, comparing, and reading about deciduous and coniferous trees. The activities are...
Alabama Learning Exchange
Probability with Tree Diagrams
Middle school math whizzes view a PowerPoint tutorial on tree diagrams. Using "Anthonio's Pizza Palace," an interactive activity involving the selection of pizza toppings, they use Pascal's triangle as a tree diagram. This is an...
Curated OER
Cyber Combos
Students use lists and tree diagrams to identify possible combinations of objects. They systematically list all possible choices, and predict the number of outcomes using multiplication.
Curated OER
Our Diverse Heritage Family Tree
Learners discuss family trees and create their own family trees. They research their cultural backgrounds and make oral presentations to the rest of the class during a multicultural lunch.
Math Learning Center
Grade 5 Supplement Set A2 – Number and Operations: Primes, Composites and Common Factors
Incorporate riddles into your math lesson by having students make tree factors and determine if the number is a prime or composite. They will also use other clues to find the answer to the riddle while sharpening their...
Curated OER
Algebra II: Fundamental Counting Principal
Students the Fundamental Counting Principal and tree diagrams to determine the total number of choices given sets of data. Using the class roster, they create a tree diagram to identify the number of student groups. Then students apply...
Curated OER
Drama: The New Friends
Reader's Theater is a great way to build fluency, intonation, and dramatic flare. The class reads the theater piece, "The New Friends" paying attention to how they express emotion and feeling as they read. They discuss the use of plot,...
Curated OER
Math Combinations
Learners examine how to use lists, tables, and tree diagrams to solve math combinations. They create various combinations of outfits using clothing manipulatives, watch an episode of the PBS series Cyberchase, and play an interactive...
Texas Instruments
Probability of Repeated Independent Events
Statisticians analyze different samples to find independent and dependent events. In this probability lesson, pupils predict the outcome and then calculate the real outcome. They create a tree diagram to help predict the probability of...
Los Angeles County Office of Education
Assessment For The California Mathematics Standards Grade 6
Test your scholars' knowledge of a multitude of concepts with an assessment aligned to the California math standards. Using the exam, class members show what they know about the four operations, positive and negative numbers, statistics...
Utah Education Network (UEN)
Probability and Statistics
MAD about statistics? In the seventh chapter of an eight-part seventh-grade workbook series, learners develop probability models and use statistics to draw inferences. In addition, learners play games and conduct experiments to determine...
Curated OER
Hitchhikers in the Bathroom
Young scientists will go buggy over this resource. After reading a passage that describes the pseudoscorpion, individuals respond to questions about this clever arachnid and use a Venn diagram to compare the pseudoscorpion to a real...
Science Matters
Ecosystem Pre-Assessment
Test scholars' knowledge of ecosystems with a 20-question pre-assessment. Assessment challenges learners to answer multiple choice questions, read diagrams, and complete charts.
Curated OER
Tennis Triangle
Learners calculate the height of a tree or flagpole. They measure the shadow of the tree or flagpole and the length of a shadow of a meterstick. Using similar triangles, calculate the heigh. Devise two additional ways in which to measure...
CK-12 Foundation
Add and Subtract Decimal Numbers: Losing Little Bits
An interactive offers five questions that challenge scholars to subtract decimals. A diagram featuring a tree and birdhouse with moveable parts is designed to assist mathematicians in finding solutions. Types of questions include...
Curated OER
Heads-Up Probability
Second graders use tree diagrams to predict the possible outcomes of coin tosses. The data they collect and graph also help them predict the likelihood of getting heads or tails when tossing coins the next time.
Curated OER
Variation
Students recognize similarities and differences in plants. In this plants and animals lesson, students begin to classify living things by observable characteristics. Students watch clips from the Internet and play online games. Students...
Curated OER
Let's Make a Map
Second graders draw maps of their playground, noting objects such as trees and play equipment. Working in groups, they make maps of different parts of the school and assemble them into a schoolwide map. They make maps on a field trip to...
Virginia Department of Education
Middle School Mathematics Vocabulary Word Wall Cards
Having a good working knowledge of math vocabulary is so important for learners as they progress through different levels of mathematical learning. Here is 125 pages worth of wonderfully constructed vocabulary and concept review cards....
Houghton Mifflin Harcourt
Unit 8 Math Vocabulary Cards (Grade 4)
Enhance fourth graders' math vocabulary with 17 word cards and their definitions. Learners focus on terms that deal with graphing, such as y-axis, coordinates, plot, and ordered pair in the last set of math vocabulary cards.
Curated OER
Introduction to the Concept of Probability
Middle and high schoolers have a clarified definition of probability, they explore about outcomes in probability and how to calculate experimental probability. They use computers to learn about probability.
Raytheon
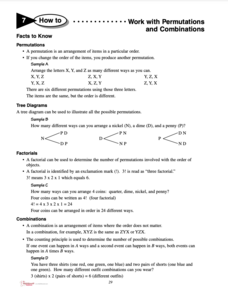
Permutations and Combinations
For this permutations and combinations worksheet, students complete word problems and pattern problems dealing with permutations and combinations. Students complete 14 problems total.
Curated OER
Probability and Expected Value
Students collect data and analyze it. In this statistics lesson, students make predictions using different outcomes of trials.
National Park Service
Fire Ecology on the Rim
An engaging unit on wildfires includes three sections, including a background section with eight lessons and five activities, a field experience section with 13 lessons and five activities, and a conclusion section featuring an...
Other popular searches
- Tree Diagrams Probability
- Math Tree Diagrams
- Tree Diagrams for Math
- Branching Tree Diagrams
- Tree Diagrams Dice Game
- Grammar Tree Diagrams
- Tree Diagrams Hurricanes
- Tree Diagrams and Probability
- Probability With Tree Diagrams
- Branching Out Tree Diagrams
- Outcomes and Tree Diagrams
- Tree Diagrams for Probability


