Curated OER
Preparation and Transition to Two-Column Proofs
Students investigate proofs used to solve geometric problems. In this geometry lesson, students read about the history behind early geometry and learn how to write proofs correctly using two columns. The define terminology valuable to...
Curated OER
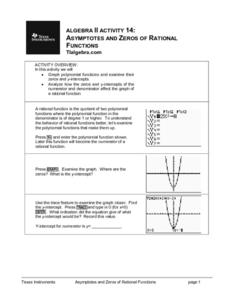
Asymptotes And Zeros of Rational Functions
Budding mathematicians graph polynomial functions and examine their zero and y-intercepts. They analyze how the zero and y-intercepts of the numerator and denominator affect the graph of a rational function. Several great additional...
Curated OER
What Are My Chances?
Students calculate probability. In this lesson on probability, students use given data to calculate to chances of a given event occurring. Many of the calculations in this lesson are applicable to daily life.
Curated OER
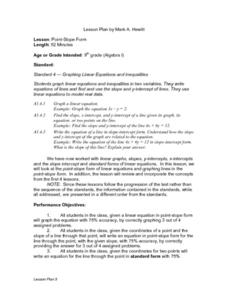
Point-Slope Form
Ninth graders explore the point-slope form of linear equations and graph lines in the point-slope form. After completing the point-slope equation, they identify the slope of a line through a particular point. Students explain the...
Pennsylvania Department of Education
Extending Pattern Understandings
Learners use shapes and manipulatives to demonstrate patterns. In this patterns lesson plan, students also break up patterns to identify a pattern unit.
Curated OER
Party Time
Learners explore the cost of a party. In this math lesson, students plan a party and determine the cost of hosting a party. Learners use information from grocery stores to determine the unit cost of items for the party.
Curated OER
Scale factors: Ratios and Proportions
Students create building and models using scale factors. In this geometry lesson, students apply the properties of ratio and proportion to solve problems. They identify the means and extremes property of cross multiplication.
Curated OER
Temperature Bar Graph
Learners explore mean, median and mode. In this math lesson, students analyze temperature data and figure the mean, median, and mode of the data. Learners graph the data in a bar graph.


