Curated OER
A Christmas Project
Seventh graders publish a letter and spreadsheet using the computer. They build a three-dimesnsional object with construction paper and develop a Christmas object using coordinates on a graph. Students compose a response in their journals.
Curated OER
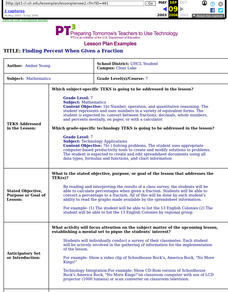
Finding Percent When Given A Fraction
Seventh graders calculate percentages when given a fraction. They convert a percentage to a fraction. All of this be done by each student's ability to read the graphs made available by the spreadsheet information.
Curated OER
Dough Lake Topology
High schoolers practice coordinates and measurements, develop 2D, 3D topological map, construct grid with string on real surface, establish "level" fixed point for measurements, take and record data points of elevation, and enter data on...
Curated OER
Using Computers to Produce Spreadsheets and Bar Graphs
Students review graphing terminology and how to plot data points, how to input data into a spreadsheet, and how to make a chart using a computer.
Curated OER
Caching in Pine's Treasures
Students compile image information about the Junior High School using a digital camera. They survey the area making observations and recording them with the help of portable technology and transferring the data to a spreadsheet and...
Curated OER
Fencing Your Backyard
Students use geosketch ro create a fence. In this geometry lesson, students identify the amount of material and area needed to create a fence. They calculate the perimeter and surface area of their fence.
Curated OER
Typhoon Project
Learners graph and outline the path of a typhoon. In this algebra lesson plan, students measure the path of the typhoon and create a graph with their data. They analyze the data and make predictions.
Curated OER
Graphs and Spreadsheets
Students collect data and present it in a graph and/or a spreadsheet, depending on their previous understanding of technology.
Curated OER
Compare 2-D Shapes
Second graders explore and analyze plane shapes. In this plane shapes instructional activity, 2nd graders evaluate shape attributes to classify shapes correctly. Students work in groups to create different shapes.
Curated OER
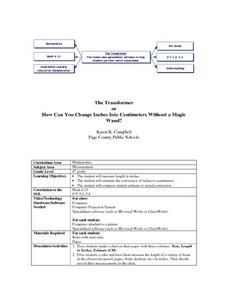
The Transformer
Fourth graders practice measuring different objects in inches. Individually, they estimate the length of the same object in centimeters and then calculate the actual length. They compare and contrast their estimate to the actual length...
Curated OER
Comparing Temperatures in Different Cities
Students generate a spreadsheet to calculate average daily temperature. They create graphs from spreadsheet data and comprehend the components of the a spreadsheet.
Curated OER
Graphing With Second Graders
Second graders sort M & M's and then enter the data into a spreadsheet in order to create a simple graph. After printing the spreadsheet generated graph, have students compare the printed graph with their paper graph.
Curated OER
Measuring Mania
Middle schoolers rotate through stations in the classroom, completing different types of measurements. These measurements are placed into a spreadsheet, and a scatter plot is generated. They type an explanation of their results in...
Curated OER
Electronic Spreadsheets & Iditarod 2000
Learners use the Internet for gathering information for Iditarod race journals. They use a spreadsheet program for entering data and making charts for showing changes in speeds achieved over a period of four weeks in timed writings in...
Curated OER
Graphing Galore!
Students practice sorting and counting different objects. Using this information, they create graphs on a worksheet given to them. They describe and analyze the results and discuss them as a class to end the lesson. They also complete...
Curated OER
Strength Building
Fifth graders go to each of the 3 stations testing their maximum strength and then make a spreadsheet and how to work with excel. Students create and finish their spread sheet on how they did on day 1.
Curated OER
Graphing Pockets
Second graders explore graphing. They count the number of pockets on their clothes and use Microsoft Excel to enter their data. Students create a class graph displaying their findings.
Curated OER
Fly Away With Averages
Students study mean, median, and mode. They construct paper airplanes and test them to see how far they fly. They measure the distance and then find the averages of their throws. They use spreadsheet software to record the data in a...
Curated OER
Animals In Your Neighborhood
Students make list of all animals they have seen in their backyards, neighborhoods, and around school in past week, graph animals using computer spreadsheet program, and compare graphs through email with students in another class.
Curated OER
Learning About Graphics
Students practice using and filling in a spreadsheet. They also create graphs and charts that coorespond with the data. This is a unit comprised of four lesson plans.
Curated OER
Statistics and Graphing with Accelerated Math
Young scholars create charts and graphs, using a spreadsheet program, of their results from their accelerated math lessons. Students discover how graphs can be used to interpret data in our everyday lives as well as how several...
Curated OER
World Education Statistics
Young scholars use a spreadsheet from The Digest of Education Statistics and convert the statistics to percentages, and create a chart of their new data. Students discuss their findings about the disparities in educational spending among...
University of Missouri
Money Math
Young mathematicians put their skills to the test in the real world during this four-lesson consumer math unit. Whether they are learning how compound interest can make them millionaires, calculating the cost of remodeling their bedroom,...
Curated OER
WORKING WITH WORKBOOKS
Students work through problems in the textbook and teacher-made problems to reinforce the new learning. They turn in practice problems to instructor to be checked for accuracy and evidence of understanding


