Curated OER
Strike a Pose: Modeling in the Real World (There's Nothing to It!)
Adjust this lesson to fit either beginning or more advanced learners. Build a scatter plot, determine appropriate model (linear, quadratic, exponential), and then extend to evaluate the model with residuals. This problem uses real-world...
Curated OER
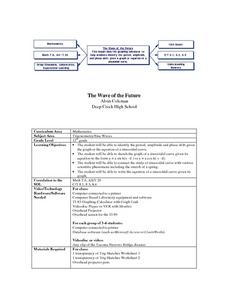
The Wave of the Future
Twelfth graders discuss sine curves and enter equations into their graphing calculator then compare different graphs created on their calculators. They identify the period, amplitude and phase shift given the graph or the equation of a...
Curated OER
Line of Best Fit
Students identify the line of best fit. In this statistics lesson, students collect and analyze data. They calculate the regression equations and identify the different types of correlation.
Curated OER
La Toteca- A Tropical Paradise
Students collect data on the time of the ferry. For this algebra lesson, students use the data to predict a ferry schedule. They also compute the depth where oxygen would be needed when diving.
Curated OER
Let's Get Physical
Students collect data using the CBL. In this statistics lesson, students predict the type of graph that will be created based on the type of activity the person does. The graph represents heart rate depending the level of activity.
Curated OER
How Much Is Too Much?
Students examine population growth and collect data. In this statistics instructional activity, students create a scatter plot to represent the different species found in the water and are being harvested. They graph their data and draw...
Curated OER
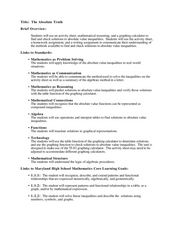
The Absolute Truth
Young scholars solve problems of inequalities and equations. In this algebra lesson, students add, subtract, multiply and divide to solve inequalities. They graph their solutions on a number line.
Curated OER
What's The Point?
Learners solve word problems using the correct math symbols. In this algebra lesson, students use the TI calculator to graph their equation and analyze it. They find the line of regression and use to draw conclusion.
Curated OER
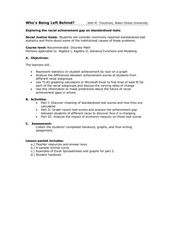
Who is Being Left Behind?
Learners investigate scores as they relate to race. In this algebra lesson, students analyze standardized scores and how race can affect these scores. They plot their findings on a graph and draw conclusions.
Curated OER
The Fuelish Fact Finding
Students define fluctuation and the price of food. In this algebra activity, students create a budget to live on based on their living expenses. They create a chart and explore the cause and effect of real life scenarios.
Curated OER
Slopey Math
Students identify the slope of a line and use it to solve real life problems. In this algebra lesson, students write linear equations in slope intercept form and make a correlation to its relation to the real world. They use the slope an...
Curated OER
Linear Functions
Students solve and graph linear equations. In this algebra activity, students collect data and plot it to create a linear function. They identify the domain and range of each line.
Curated OER
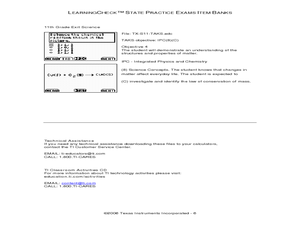
LearningCheck State Proactice Exams Item Banks
Students examine state practice test exams questions. In this secondary mathematics exam, students receive instructions for downloading state practice exams, using the test item banks with the TI-Navigator system, and view sample exam...
Curated OER
Linear Functions-Learn Your Lines
Students solve and graph linear equations. In this algebra lesson, students collect and plot data on a coordinate plane. They use the CBL and TI calculator to graph systems of equation.
Curated OER
Batteries in Series: Voltage and Light Intensity
Students participate in a hands-on activity to explore the relationship between the number of batteries in a series circuit and its voltage. Students identify the relationship between two variables and plot points on a graph.
Curated OER
Skate Party
Learners use the Frayer model during problem solving. For this problem solving lesson, they examine multiple methods of data collection to solve real world problems. Resources are provided.
Curated OER
Famous Public Properties
What can a middle schooler do in 90 minutes? He can practice using the commutative, associative and distributive properties of addition and multiplication. He can also simplify expressions using the commutative, associative and...
Curated OER
Integration Unit: Riemann Sum
Pupils investigate Riemann Sums. In this calculus lesson, students solve problems involving Riemann sums and Right Riemann Sums.
Curated OER
Understanding Equations of Functions
Pupils write equations for different functions. In this algebra lesson, students observe data and find the function that goes along with that data. The identify the line of best fit.
Curated OER
Modeling With Circular Functions
Learners explore circular functions. They identify the amplitude, period, phase shift and vertical shift of circular functions. Students analyze phenomena described by sine waves and they find mathematical models for transforming images...


