Curated OER
A Wee Dose of JavaScript
Students describe the difference between Java and JavaScript. They explain the relationship of JavaScript to other elements of an HTML document. They write general code for a set of JavaScript instructions. They describe the JavaScript...
Curated OER
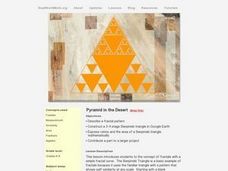
Pyramid in The Desert
Young scholars investigate the Sierpinski triangle and calculate the ratio and area of the triangle. For this fractals lesson, students calculate parts of a Sierpincki triangle. They use Google Earth to help them construct the different...
Curated OER
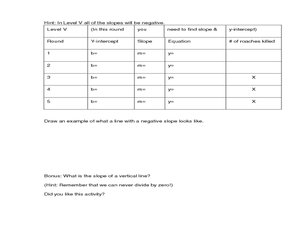
Cockroach Slope
Students identify the slope of linear functions. For this slope lesson, students collect data and graph it. They write equations with no more than two variables and use technology to explain their data.
Curated OER
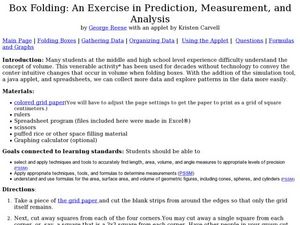
Box Folding: Predict, Analyze and Measure
Learners predict the shape of a geometric figure in 3D. In this geometry lesson, students construct 3D shapes to perfect their knowledge of measuring and predicting. This assignment is also available as an online interactive lesson.
Curated OER
Collecting and Organizing Data
Fifth graders explore methods of generating and organizing data. Afterward, they visit a specified website where they analyze data, organize, and create graphs. Students follow instructions and complete answers to questions. They...
Curated OER
Adding Trigonometric Functions
Students identify trigonometric functions. In this trigonometry lesson, students add and subtract trigonometric functions. They add sine and cosine waves and relate it to the real world.
Curated OER
Graph Creator
Students rewrite equations using algebraic symbols. In this algebra lesson plan, students graph linear equations using the slope and y intercept. They make predictions about their graphs and analyze the results.


