Curated OER
Rate of Change Graphically
Learners calculate the rate of change. In this algebra instructional activity, students identify the slope and discuss the different properties of lines as they relate to rate. A discuss doubling time, zero slope and being in two places...
Curated OER
Rate of Change
Students observe and calculate slopes. In this algebra lesson plan, students graph equations and determine the pace at which the slope is changing. They use the navigator to see the change as they graph the lines around.
Wordpress
I Can Find Slope
Your young mathematicians will appreciate this wonderfully organized summary and explanation of linear slope. Approaching slope as it looks in a table of values, on a graph, in an equation, and between two points, this note sheet is...
Curated OER
Slippery Slope
Middle schoolers use a computer to complete activitites about slope. They find the slope of mountains, roofs, and stairs using rise over run. Pupils are shown different types of slopes and have to identify if the slope is positive,...
Curated OER
Algebra 1: Slope as Rate
Students solve problems with slopes. In this algebra lesson, students identify the slope of a line and relate it to the rate of change. They graph their lines on the TI and observe changes in the lines.
Curated OER
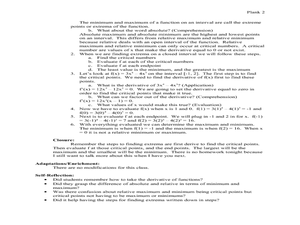
Extrema on an Interval
Students explore maximum and minimum points, slopes and tangents. For this Pre-Calculus lesson, students solve optimization problems and find rates of change.
Curated OER
Graphing Lines That Don't "Fit"
How can you graph lines that don't seem to fit on the given graph? What makes a line straight? What does the rate of change mean when graphing a line? How do you know if a slope is positive or negative? How do you know if the graph of a...
Curated OER
Slope & Rate of Change
This short handout addresses the concept of slope in two different ways: geometrically and analytically. Start with a brief description of slope, then use graphical representations to compare positive vs. negative slope and zero vs....
Curated OER
Introducing y = mx + b
Middle and high schoolers use the slope intercept form to graph a line. In this algebra lesson, pupils rewrite equations from standard form to y-intercept form. They use the slope and y-intercept to graph a line without making a table of...
Curated OER
Juggling Slopes
Students identify the slope of a line. For this algebra lesson, students label slopes as positive, negative, zero or undefined. They use the slope formula to find the slope algebraically and graphically.
CK-12 Foundation
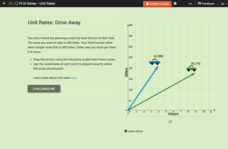
Comparison of Unit Rates: Drive Away
Five questions make up an interactive that challenges mathematicians to compare unit rates. Word problems question scholars about two friends going on a road trip. Scholars manipulate two cars on a coordinate plane to help solve word...
Curated OER
Lines, Lines, Everywhere
Students explore linear equation suing real life scenarios. In this algebra lesson, students find the slope and intercept of a line. They create table of values to plot their graph and draw conclusions.
Curated OER
Modeling Linear Relationships
Students graph lines using the slope and y-intercept. In this algebra lesson, students create data using tables and equations. They use their data to make predictions and draw conclusion.
Curated OER
Linear and Exponential Functions
This comprehensive unit on linear and exponential functions provides numerous clearly-written worksheets. Topics include graphing linear equations, solving systems of equations algebraically and by graphing, identifying the domain and...
Curated OER
Race The Rapper: Slopes
Learners calculate the slope of the equation In this algebra lesson, students graph coordinate pairs of linear equations and identify the relationship between x and y values and slope. They differentiate between functions and...
Curated OER
Every Graph Tells A Story
Seventh graders explore linear equations. In this graphing lesson plan, 7th graders explore constant rates of change. Students discover the real-life application of graphs and demonstrate their ability to read graphs and...
Curated OER
Baseball Relationships - Using Scatter Plots
Students use graphing calculators to create scatter plots of given baseball data. They also determine percentages and ratios, slope, y-intercepts, etc. all using baseball data and statistics.
Curated OER
Exploring the Slopes of Parallel and Perpendicular Lines
Students calculate the slope of parallel and perpendicular lines.In this algebra lesson plan, students differentiate between parallel and perpendicular lines. They graph their lines using the slope of the equation.
Curated OER
Exploring the Slopes of Parallel and Perpendicular Lines.
Pupils find the slopes for perpendicular and parallel lines. In this geometry lesson, students differentiate between parallel and perpendicular lines. They use Cabri software to create lines to compare.
Curated OER
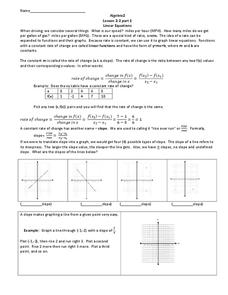
Linear Equations
Pre-algebra pupils examine the rate of change and how we can interpret it as a linear function. They are introduced to slope-intercept equations and graphs. Plenty of instruction is provided along with example problems. Note that even...
Curated OER
Inequalities 7.3
Graph inequalities and discuss the difference in their slopes. Learners observe rate of change as they compare linear, quadratic, and cubic functions.
Curated OER
Slopes of Lines
Students examine a graph and relate it to the real world situation it depicts. They investigate changes in an equation and the appearance of a line. They investigate the connection between the graph of a situation and the meaning of the...
Curated OER
Mine Shaft Grade 8 Slope
Eighth graders investigate slopes using real life scenario. In this algebra lesson, 8th graders model and interpret real life data. They plot their data in a coordinate plane and discuss the results with the class.
Curated OER
Slope Calculation
Middle schoolers practice calculating the slope of a line. They explain how the formula is derived and identify properties that are associated with positive, negative and undefined slopes. They complete an online activity as well.


