Curated OER
Charting and Graphing Sales
Students analyze graphs, charts and tables. For this data analysis lesson, students practice creating and analyzing charts, graphs and tables corresponding to sales and surveys. This lesson uses data relevant to students and includes...
Curated OER
A Data Processing Lesson for Statistics -- Reading a Table or Chart
Learners identify the structure and key parts of tables and charts. They determine which data is meanjngful and make comparisons with the data. They describe the scope of the AIDS plague throughout the world.
Curated OER
Muggie Maggie
Learners explore the book Muggie Maggie by Beverly Cleary. In this vocabulary instructional activity, students read to discover multiple meaning words, synonyms, antonyms and identify important details. Learners make story predictions...
Curated OER
Colorful Fractions
Students use charts to show fractions. In this fractions and percents instructional activity, students review fractions, percents and ratios. Students create tables and color the cells to make different fractions. ...
Curated OER
Technology Integration Lesson Plan: Civil War Spreadsheet
Eighth graders discuss and analyze Civil War data, manually graph data on handout, work with partners to enter data into spreadsheets, and create charts on spreadsheet for each data set.
Curated OER
Excel temperature Graphs
Students gather data about the weather in Nome, Alaska. For this Nome Temperature lesson, students create an excel graph to explore the weather trends in Nome. Students will find the average weather and add a trend line to their...
Florida Center for Reading Research
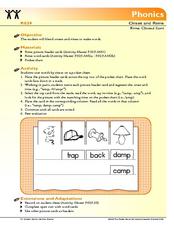
Phonics: Onset and Rime, Rime Closed Sort
Practice onset and rime with this word sort activity. Beginning readers lay out the four picture cards along the top of the chart: fan, cap, tack, and lamp. Then, they flip word cards and sort them beneath the image with the same rime....
Curated OER
Graphing
Fifth graders create graphs based on climate in South Carolina. They read and interpret information in a chart and construct a graphy from the information in the chart. They create a spreadsheet using Excel and publish 2 graphs.
Curated OER
Getting There
Students practice reading a pictograph. In this data analysis lesson plan, students collect data and create their own pictograph. A students worksheet is included.


