Curated OER
Basic Excel
Students explore basic Excel spreadsheets. In this spreadsheet lesson plan, students enter Alaska weather information and perform calculations. Students title the columns on the spreadsheet and format the cells. ...
Curated OER
Escape Velocity
Sixth graders create/use spreadsheets to solve real-world problems, explore patterns, make predictions, select/explain most appropriate types of graph to display data, use information to create product, and have basic understanding of...
Council for Economic Education
Loan Amortization - Mortgage
When you buy a home for $100,000, you pay $100,000—right? On the list of important things for individuals to understand, the lesson presents the concept of interest rates and loan amortization using spreadsheets and online sources....
Curated OER
Spreadsheets and Database in Social Studies
Fifth graders create/use spreadsheets to solve real-world problems, explore patterns and make predictions, select/explain most appropriate types of graph to display data, and enter data into a prepared spreadsheet to perform calculations.
Curated OER
Hopes and Dreams: A Spreadsheet Lesson Using Excel
Fourth graders read "The Far Away Drawer" by Harriet Diller and discuss the story as a class. After discussion, 4th graders create a t-shirt GLYPH about their hopes and dreams,share their information with the class and create spreadsheets.
Curated OER
Using Computers to Produce Spreadsheets and Bar Graphs
Students review graphing terminology and how to plot data points, how to input data into a spreadsheet, and how to make a chart using a computer.
Curated OER
Baseball Relationships - Using Scatter Plots
Students use graphing calculators to create scatter plots of given baseball data. They also determine percentages and ratios, slope, y-intercepts, etc. all using baseball data and statistics.
Curated OER
Moving Day!
Eighth graders continue their geometry unit by focusing on volume. Using data, they create a spreadsheet, estimate and calculate volume. They solve real-life problems and round their answers to the hundredths place. They also practice...
Curated OER
Super Spreadsheets
Students develop a spreadsheet containing statistical data. They describe and interpret the data to make conclusions. They review the differences between an unorganized spreadsheet verses an organized one.
Curated OER
Electronic Spreadsheets & Iditarod 2000
Students use the Internet for gathering information for Iditarod race journals. They use a spreadsheet program for entering data and making charts for showing changes in speeds achieved over a period of four weeks in timed writings in...
Curated OER
Fantasy Basketball
Learners play Fantasy Basketball in order to practice locating Internet information and using technology tools to display data; students demonstrate an understanding and use of graphing, probability, and statistics.
Curated OER
Spreadsheet Function Machine
Students create a spreadsheet to analyze functions. In this algebra lesson plan, students use spreadsheets to find the intersection of systems of equations. They identify the dependent and independent function as it relates to a line.
Curated OER
Graphs! Graphs! Graphs!
Students practice making charts and graphs from data on spreadsheets. Individually, they create a graph representing the latest information on voter registration. They answer questions and analyze the data to end the lesson.
Curated OER
A Christmas Project
Seventh graders publish a letter and spreadsheet using the computer. They build a three-dimesnsional object with construction paper and develop a Christmas object using coordinates on a graph. Students compose a response in their journals.
Curated OER
Creating a Spreadsheet
Students create a spreadsheet using ICT. In this algebra lesson, students collect and graph their data using a spreadsheet. They find solution to a given problem using trial and error.
Curated OER
The Hot Dog Stand
Students run a computer simulation. They collect data as they work and use the data to create an annual report for their business. Several different simulations could be used for this project. It is desirable for students to do this...
Curated OER
ExplorA-Pond: 6th Grade Area and Random Number Tables
Sixth graders estimate surface area of a pond using a random number table.
Curated OER
Shoe Showdown
Third graders use rulers to measure their shoe size in inches and centimeters. They then enter the class shoe measurements into an excel data base and graph the results of both to make the comparison.
Curated OER
Two-Variable Linear Inequalities
Here is an engaging lesson plan on solving equations with two variables. Have the class rewrite linear equations in the slope intercept form, y=mx + b. They graph the lines using the slope and y-intercepts.
Curated OER
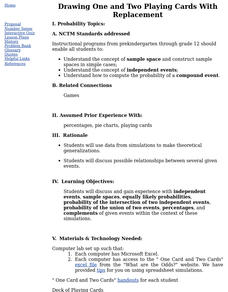
Drawing One and Two Playing Cards With Replacement
Math whizzes use data from simulations to make theoretical generalizations and discuss possible relationships between several given events. They use a simple card game to generate data to be analyzed.
Curated OER
Excel Lesson
Students explore data and Excel spreadsheets. They collect data about political candidates. Students enter the data into a chart on Excel. They create a graph using the data and Excel.
Curated OER
Scale Basketball
Young scholars discuss scale diagrams and maps as well as the use of spreadsheets to find the best scale to use in a model before practicing scale and ratio problems on their own.
Curated OER
Rise Over Run
Students define the slope of the line, find the slope between any two points on the line, and allow them to name other areas where the slope is used. They explain why the slope is defined as the rise over the run.
Curated OER
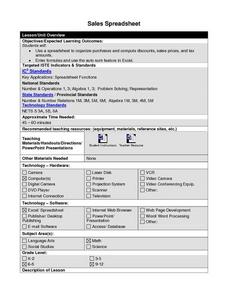
Sales Spreadsheet
Young scholars use Excel spreadsheets to organize purchases, discounts, sales prices, and sales tax. Students follow step by step instructions and enter formulas as well as use the auto sum feature to calculate required calculations.

