Curated OER
TRB 3:4 - Investigation 2 - Jump
Third graders jump with and without weights to reveal data that gravity has more of a pulling force with heavy objects that are on the ground than light objects on the ground. They also identify how their legs felt when they jumped with...
Curated OER
Introduction To Data Analysis
Seventh graders investigate the concept of looking at the data put in a variety of ways that could include graphs or data sets. They analyze data critically in order to formulate some sound conclusions based on real data. Students graph...
Curated OER
The Football and Braking Distance: Model Data with Quadratic Functions
Young scholars engage in a lesson that is about the concept of data analysis with the use of quadratics. They use a Precalculus text in order to give guidance for independent practice and to serve as a source for the teacher to use. The...
Curated OER
Spyglass
Learners distinguish between visualization and scientific visualization. They use the software program Spygalss to create images from two-dimensional arrays of numbers.
Curated OER
What's Your Favorite Planet?
Fourth graders interpret a graph and make correlations using data. After taking a class survey, 4th graders create a class graph of their favorite planets. Working in small groups, they interpret the information and create at least ten...
Curated OER
Unit 2: Lesson 7
Students are introduced to spreadsheets. They conduct a survey of television viewing time of different shows based on different age categories. Students work in small groups. They collect, data and interpret the data from a survey.
Curated OER
Spyglass Transform
Young scholars transfer information previously saved in a spreadsheet to Spyglass Transform. They visualize the data and explain what it means
Curated OER
Using My Nasa Data To Determine Volcanic Activity
Students use NASA satellite data of optical depth as a tool to determine volcanic activity on Reunion Island during 2000-2001. They access the data and utilize Excel to create a graph that has optical depth as a function of time for the...
Curated OER
Snow Cover By Latitude
Students examine computerized data maps in order to create graphs of the amount of snowfall found at certain latitudes by date. Then they compare the graphs and the data they represent. Students present an analysis of the graphs.
Curated OER
Get Connected With Ohm's Law
Students engage in a study of Ohm's Law and conduct research into how the law functions in relationship to the functions for light bulbs. They conduct hands on activities and use digital multi-meters to collect data and plot it for...
Curated OER
The Orbit Of Planet Gamma
Students investigate the concept of common errors that are made in the laboratory setting while analyzing the data of an experiment. They are given a scenario and are asked to measure the data of the major and minor axis. The purpose is...
Curated OER
Air Pollution: Visible And Invisible
Fourth graders observe air pollution that is visible and invisible with experimentation. During the experiment the students collect data that needs analysis. The observations are recorded in the lab journal. The data also is represented...
Curated OER
Coin Drop
Students calculate the theoretical and empirical probability by dropping coins on a grid. They record their data and compare the theoretical and empirical data. Students make predictions about the results before conducting the experiment.
Curated OER
How is our place connected to other places?
Second graders conduct a survey, they record their data with the help of maps. They use an aerial photo or Ordnance Survey map, 2nd graders pinpoint specific places and add them to a legend using the drawing tools. Students use...
Curated OER
Matching Pairs
Students examine the probability of the various findings in a game and determine the odds of winning. They differentiate between the facts of odds versus probability. Students use higher order thinking skills to explain how a problem is...
Curated OER
Math:Survey Role-Playing Activity
Students create survey questions to discover why students join clubs. Using sampling methods and question phrasing techniques, they conduct the survey both in and out of school. Once students analyze their survey information, they...
Curated OER
Weather Where We Are
Students investigate the reports of local weather. They identify types of weather data and correlate it to the conditions. Using the data students draw a picture of the current weather. They conduct the same investigation for all four...
Curated OER
Collecting My School Family Data
Pupils are tasked with collecting data on their school. In groups, they collect data on various aspects of school life along with social and economic backgrounds and charactertics of their hair and eye color. They draw two pictures,...
Curated OER
Fitting a Line to Data
Students work together in groups to collect data in relationship to how much water marbles can displace. After the experiment, they use the data to identify the linear equation to determine the best-fit line. They use the equation to...
Curated OER
Collecting and Organizing Data
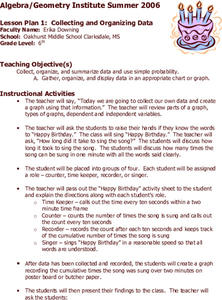
Sixth graders practice collecting and organizing data. In groups, 6th graders determine how many times "Happy Birthday" (at a reasonable rate) may be sung in ten seconds. They collect the information and create a graph.
Curated OER
Graphing Inertia: An Oxymoron?
Eighth graders investigate Newton's Law of Inertia in order to create a context for the review of the use of different types of graphs. They practice gathering the data from an experiment and put it into the correct corresponding graph.
Curated OER
What percent of ratio is proportion?
Ninth graders investigate the concepts of ratio and proportion.They solve examples with the teacher for ratios and proportions. A basic fraction review is used for a warm up in this lesson. The primary focus of the lesson appears to be...
Curated OER
What's The Teacher's Choice?
Fifth graders explore how to use data and display it using a chart or graph. They use food choices for categories and then gather the data and use the provided chart for display. In small groups students discuss the data and the results.
Curated OER
Exploring Probability
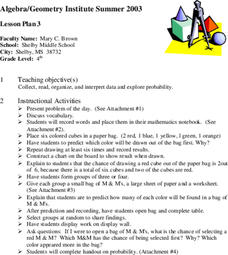
Fourth graders participate in a lesson that explores probability. They use candy and model cubes to experiment with different outcomes that can be charted if the students can proceed to the objective of the lesson. They discover how...


