Hi, what do you want to do?
TED Talks
TED: Finding life we can't imagine | Christoph Adami
How do we search for alien life if it's nothing like the life that we know? Christoph Adami shows how he uses his research into artificial life -- self-replicating computer programs -- to find a signature, a "biomarker," that is free of...
Curated Video
R Programming for Statistics and Data Science - Distributions
This video explains distributions. This clip is from the chapter "Hypothesis Testing" of the series "R Programming for Statistics and Data Science".This section explains hypothesis testing.
msvgo
Finding Mode of Grouped Data
It explains the formula to calculate the mode of a grouped data. It also explains modal class and mode of continuous grouped data.
Let's Tute
Cumulative Frequency Distribution and Graphical Representation: More Than Type
In this video, we learn about the more than type of cumulative frequency distribution and its representation in a graph called an ogive. Using an example of daily income data, the video explains how to calculate cumulative frequencies...
msvgo
Mean Deviation about Median
It explains how to compute the mean deviation about median for grouped and ungrouped data with the help of solved examples.
Let's Tute
Introduction to Cumulative Frequency and Less Than Type Ogive Graph
This video teaches about the less than type cumulative frequency and its representation in a graph. It explains how to calculate cumulative frequency, plot it on a graph, and find the median of the data. The video provides a step-by-step...
Let's Tute
Calculating Mean of Group Data using Step Deviation Method
This video explains how to find the mean of group data using the step deviation method in statistics. It provides a step-by-step guide to organizing the data, calculating mid-values and frequencies, and using the formula to find the...
msvgo
Median of Grouped Data
It explains how to compute the median of continuous frequency distribution and conversion of "less than" type and "more than" type data into cumulative frequency distribution.
Let's Tute
Introduction to Cumulative Frequency Distribution and OGIVE Graphs
This video explains how to create a cumulative frequency distribution graph, also known as an ogive, using the more than type method. It provides step-by-step instructions on how to calculate cumulative frequencies and plot them on a...
Curated Video
Data Analytics using Python Visualizations - Plotting Histograms and Box Plots
This video explains plotting histograms and box plots. This clip is from the chapter "Matplotlib and Seaborn – Libraries and Techniques" of the series "Data Analytics Using Python Visualizations".This section introduces you to...
Curated Video
Data Analytics using Python Visualizations - Marginal Histograms and Marginal Boxplots
This video explains marginal histograms and marginal boxplots. This clip is from the chapter "Matplotlib and Seaborn – Libraries and Techniques" of the series "Data Analytics Using Python Visualizations".This section introduces you to...
Let's Tute
Introduction to Cumulative Frequency and Less Than Type Ogive Graphs
This video teaches cumulative frequency and how it is represented in a graph, specifically the less than type ogive. It uses an example of daily income of workers to demonstrate how to calculate cumulative frequency, plot it on a graph,...
Curated Video
Modeling Data with the Normal Probability Distribution
In this video, the teacher explains how to model a data set using the normal probability distribution. They discuss the concepts of mean and standard deviation, and how they affect the shape and location of the distribution. The teacher...
Khan Academy
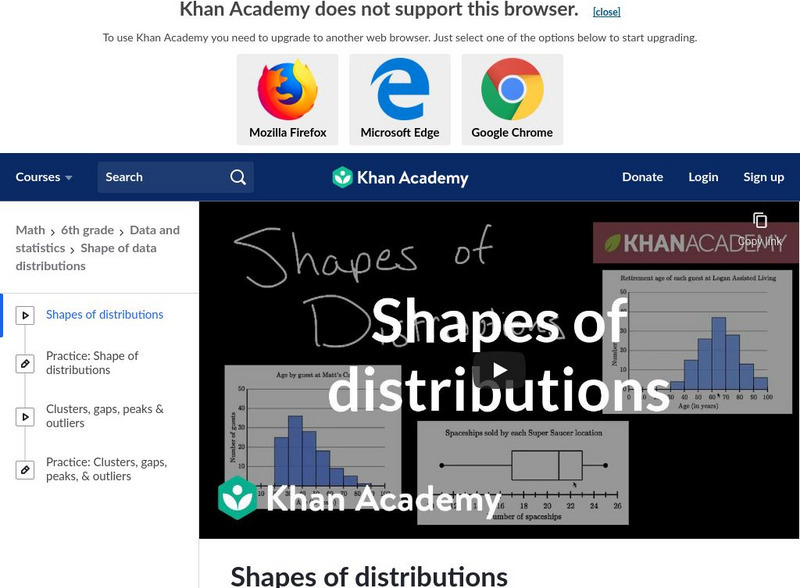
Khan Academy: Shapes of Distributions
This video discusses how to interpret a data display by looking at patterns and anomolies in the shape of its distribution. [5:06]
Sophia Learning
Sophia: Two Way Tables/contingency Tables: Lesson 3
This lesson will explain two-way tables. It is 3 of 3 in the series titled "Two-Way Tables/Contingency Tables." A transcript accompanies the video. [3:45]
Loyola University Chicago
Math Flix: Graphs: Bar Graph Histograms
This QuickTime movie introduces a specific type of bar graph called histograms. As you watch and listen to the teacher and student interact it helps clarify the thinking behind applying this concept.


