Hi, what do you want to do?
Curated OER
Unit III: Worksheet 2 - Motion Maps
Make motion maps, draw graphical representations, and determine displacement. These are the activities included in this physics assignment. This is a great review of velocity, position, acceleration, and displacement concepts.
Alabama Learning Exchange
I Know What You Did Last Summer: A Data Graphing Project
Young scholars participate in graphing data. For this graphing data lesson, students make a stem and leaf plot of their summer activities. Young scholars create numerous graphs on poster boards. Students discuss the...
Curated OER
Complex Analysis: Graphical Representations
In this graphical representation worksheet, students draw an Argand diagram depicting two complex numbers in a complex plane. They draw vectors to represent complex numbers. This two-page worksheet contains five equations to solve.
Yale University
Yale University: Categorical Data Examples
Site provides some different examples of categorical data and discusses the use of two-way tables.
Shodor Education Foundation
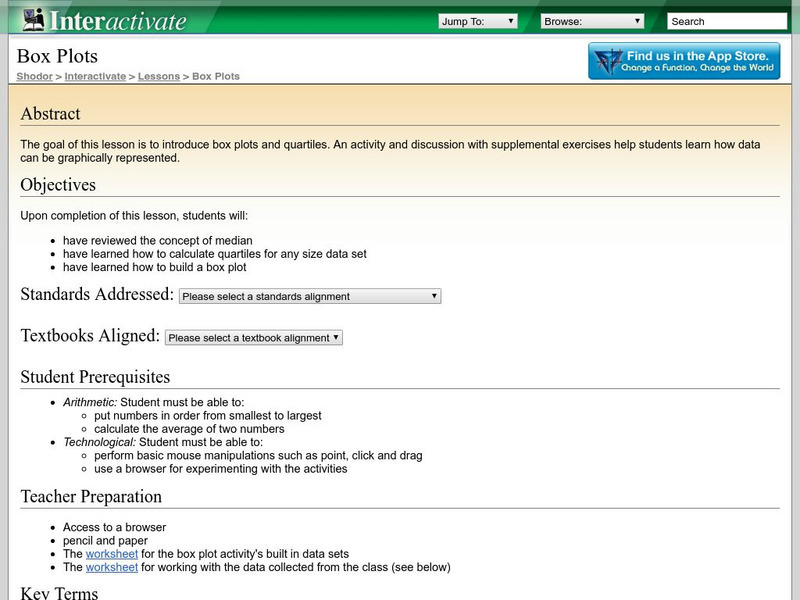
Shodor Interactivate: Lesson: Box Plots
This lesson plan introduces quartiles and box plots. It contains an activity and discussion. Supplemental activities about how students can represent data graphically are also included.
Shodor Education Foundation
Shodor Interactivate: Lesson: Stem and Leaf Plots
Lesson plan introduces students to stem-and-leaf plots. Many resources are available for student and teachers here.


