Curated OER
Graphing Grid
In this graphing worksheet, students are given a blank graph to fill in with their own information. Four columns are included, each consisting of six boxes.
Curated OER
Which is Your Favorite Dr. Seuss Book?
In this student survey worksheet, students gather information on classmates' favorite Dr. Seuss books. Students use a second worksheet to graph the results of their surveys.
University of South Florida
Fcat: Human Coordinate Plane: Teacher Notes
Students participate as a class in this activity using their desks as points on the coordinate plane. The teacher leads them in the activity, increasing their understanding of the characteristics of the coordinate plane.
University of South Florida
Fcat: Get a Half Life!: Teacher Notes
Learners use M&M's and a graphing calculator to collect and graph data. This activity helps them to understand exponential functions and the concept of half-life.
University of South Florida
Florida Center for Instructional Tech: Walking the Plank
Learners use weight to collect data and investigate the linear relationship. This activity uses a graphing calculator.
University of Regina (Canada)
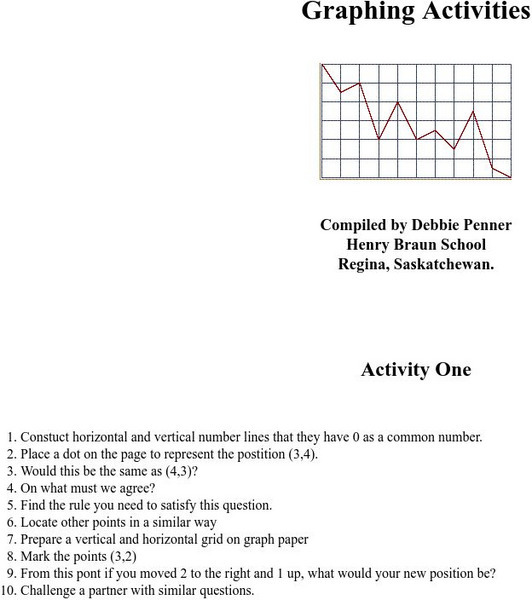
University of Regina: Math Central: Graphing Activities
Eighteen different graphing activities will teach students how to plot points, draw lines, compare graphs, and problem solve.
University of Regina (Canada)
University of Regina: Math Central: Graphing Activities
Eighteen different graphing activities will teach students how to plot points, draw lines, compare graphs, and problem solve.
University of South Florida
Florida Center for Instructional Tech: Wacky Water World
At this site investigate linear equations with a graphing calculator. Data is gathered from a hypothetical situation of purchasing tickets at a waterpark.
The Franklin Institute
Frankin Institute Online: Group Graphing
This site from The Franklin Institute explores how to make a simple graph using a spreadsheet to portray survey data. It also gives a set of interesting sports-related web sites so that students can get statistical inforamtion.
Other
Linear Functions, Slope and Regressions
Find activities here for linear functions, slopes and regression lines. Use them for classroom work or individual assignments.
Scholastic
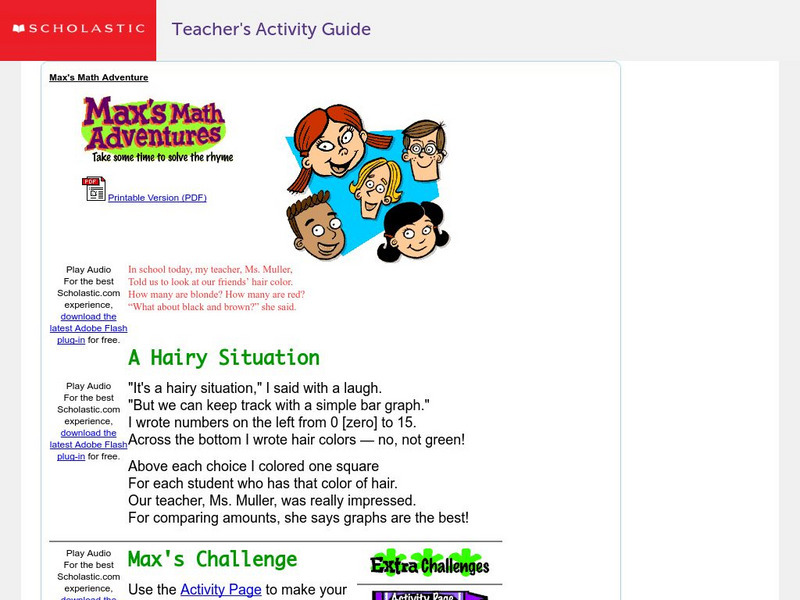
Scholastic: Max's Math Adventures: A Hairy Situation
Help Max make a bar graph to show the hair colors of his classmates. Teachers will appreciate the activities with bar graphs in the extra challenges. Use the teacher's guide to create a fun and engaging lesson.
University of South Florida
Fcat: Exploring Linear Equations: Teacher Notes
This lesson plan guides young scholars through the use of a graphing calculator to explore the slope and y-intercept of a line.


