Hi, what do you want to do?
Sophia Learning
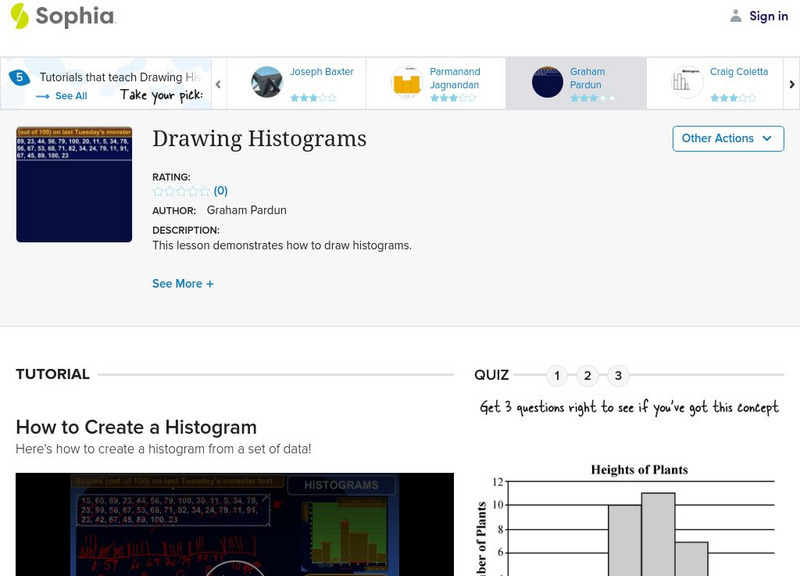
Sophia: Drawing Histograms
Given a data set, explore how to create a histogram. Complete quiz to assess understanding. [9:42]
Virtual Nerd
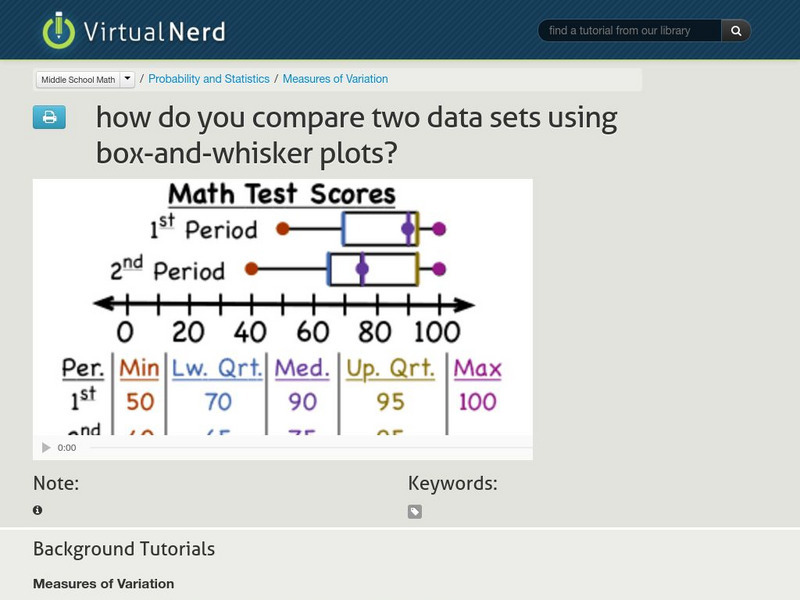
Virtual Nerd: How Do You Compare Two Data Sets Using Box and Whisker Plots?
How do you describe the similarities and differences between two data sets using box-and-whisker plots? This video gives you a great explanation using an example of test scores from two different math classes. [5:27]


