Curated Video
GCSE Secondary Maths Age 13-17 - Probability & Statistics: Interpreting Data - Explained
SchoolOnline's Secondary Maths videos are brilliant, bite-size tutorial videos delivered by examiners. Ideal for ages 13-17, they cover every key topic and sub topic covered in GCSE Maths in clear and easy to follow steps. This video...
Curated Video
Creating Bar Graphs
Draw a simple scaled bar graph to represent data with several categories.
Curated Video
Drawing Detailed Bar Graphs
Draw a detailed scaled bar graph to represent data with several categories.
Curated Video
Counting Siblings (Draw a line plot to represent data with several categories.)
Suppose we want to count the number of brothers and sisters each student has in John's class and then represent the information in a line plot.
Curated Video
Interpreting Data on a Line Plot
In this video, the teacher explains how to interpret data on a line plot to solve a problem. The line plot represents a survey of 20 people and shows the number of hours they exercise each day. The teacher demonstrates how to find the...
Curated Video
Drawing Pictographs
Draw a scaled pictograph to represent data with several categories.
Khan Academy
Khan Academy: Reading Bar Graphs: Bikes
Sal reads and interprets bar graphs to determine which store has the most bikes. Includes a video, transcript, and question and answer section. [1:42]
Khan Academy
Khan Academy: Reading Bar Graphs: Dog Bones
Sal reads and interprets various bar graphs. Includes a video, transcript, and question and answer section. [2:56]
Khan Academy
Khan Academy: Creating Picture and Bar Graphs 1
Sal creates and interprets bar and picture graphs. Includes a video, transcript, and question and answer section. [4:57]
Other
David Hunter: Historical Analysis and Interpretation
A video featuring methods to gather valuable facts and interpretations and how to differentiate between the two. [5:21]
Virtual Nerd
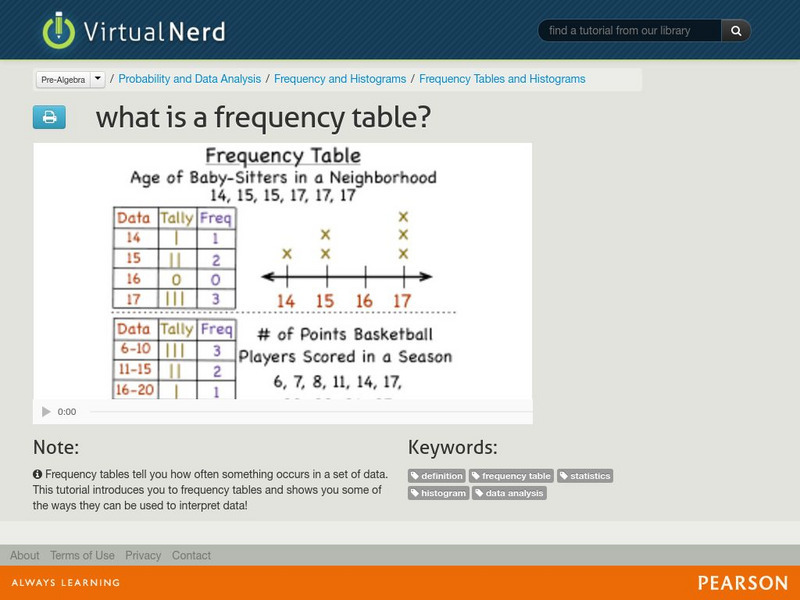
Virtual Nerd: What Is a Frequency Table?
Video serves as an introduction to frequency tables which tell you how often something occurs in a set of data. [6:44]
Varsity Tutors
Varsity Tutors: Hotmath: Graphing Calculator Practice Problems: Statistics
Practice using your graphing calculator for statistics problems, including displaying and interpreting data. If you get stumped or if you would like to check your work, then select the View Solution button, which is located directly...
Khan Academy
Khan Academy: Reading and Interpreting Data: Reading Bar Graphs
A video showing how to interpret a bar graph.
Khan Academy
Khan Academy: Reading and Interpreting Data: Misleading Line Graphs
Demonstration of how graphs can use different scales to mislead. [4:52]
Khan Academy
Khan Academy: Reading and Interpreting Data: Stem and Leaf Plots
This video gives example of creating stem-and-leaf plots.
Khan Academy
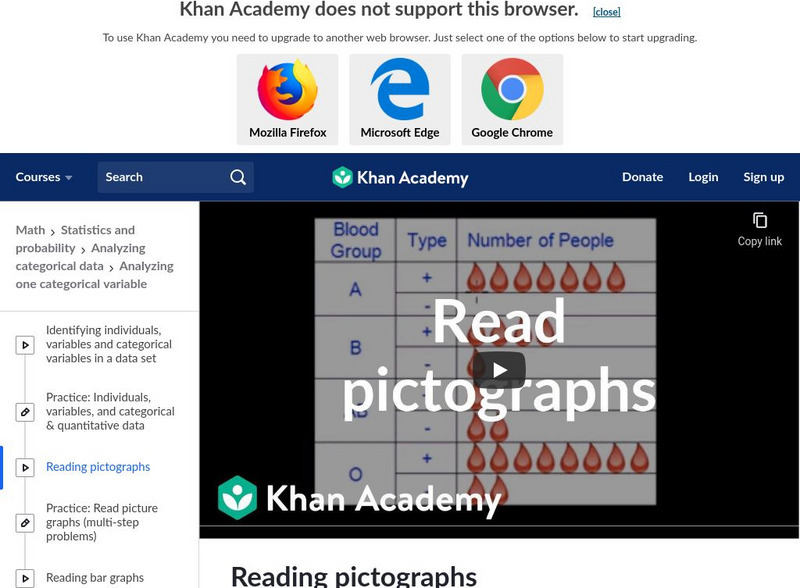
Khan Academy: Reading and Interpreting Data: Reading Pictographs
Video example of reading a pictograph to answer a question including using a scale.
Khan Academy
Khan Academy: Picture Graphs
A picture graph, or pictograph, is a graph used to display information that uses images or symbols to represent data. This video demonstrates how to interpret a pictograph of where mice live on a farm. Includes a video, transcript, and...
Other
Qlik: Understanding Data
This course is designed to help users gain an understanding of Data, learn about different types and attributes of data, and help them understand why this information is important in the world today. Includes two videos (25 min....
Khan Academy
Khan Academy: Solving Problems With Pictographs 2
Sal Khan uses picture graphs to solve word problems. [3:38]
Khan Academy
Khan Academy: Interpreting Picture Graphs: Paint
Lindsay from Khan Academy solves a multi-step word problem involving a picture graph. [1:22]
Khan Academy
Khan Academy: Interpreting Linear Functions Harder Example
Watch [4:52] Sal work through a harder Interpreting linear functions problem.
Khan Academy
Khan Academy: Interpreting Linear Functions Basic Example
Watch [2:16] Sal work through a basic Interpreting linear functions problem.
PBS
Pbs: Odd Squad: Mathroom Sorting and Classifying Answers
Learn about organizing and interpreting data with the Odd Squad. The agents have to organize their data about the escaped literary characters. Olive, Otto and Oscar visit the Mathroom to chart their results and interpret the data.


