Hi, what do you want to do?
Curated OER
What is a Frequency Table?
So you have a data set and you want a visual diagram to help you analyze the data. Not sure how to draw it? The instructor illustrates four different ways to look at a frequency table: two tally tables, one line graph, and one bar graph....
Curated OER
What is a Frequency Table?
So you have a data set and you want a visual diagram to help you analyze the data. Not sure how to draw it? The instructor illustrates four different ways to look at a frequency table: two tally tables, one line graph, and one bar graph....
Virtual Nerd
Virtual Nerd: How Do You Make a Histogram?
Make a histogram to show off data in a visual way. This video will walk you through the process and provide examples. [5:34]
Virtual Nerd
Virtual Nerd: What Is a Histogram?
How can you display numerical data in an easy to understand format? Watch this tutorial to find out how a histogram is helpful when analyzing and visualizing data. [5:23]
Annenberg Foundation
Annenberg Learner: Against All Odds: Histograms
Meteorologists use histograms to map when lightning strikes and this visualization technique helps them understand the data in new ways. [9:42]
Texas Education Agency
Texas Gateway: Study Edge Statistics: Box Plots and Comparing Distributions
Explains the features of box plots and the statistical vocabulary that is used when describing them. Also models how to compare and contrast distributions. Includes downloadable study guide with exercises - guide also covers other...
Texas Education Agency
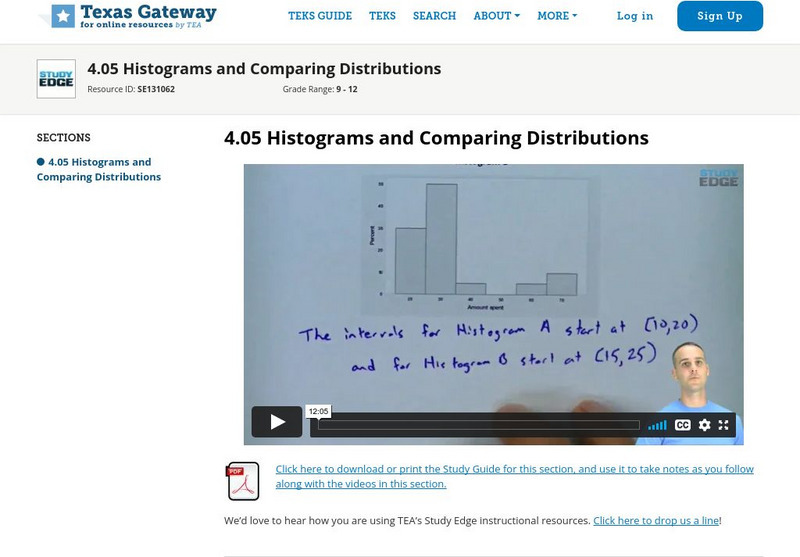
Texas Gateway: Study Edge Statistics: Histograms and Comparing Distributions
Explains the features of histograms, when they are useful, and the statistical vocabulary that is used when describing them. Also models how to compare and contrast distributions. Includes downloadable study guide with exercises - guide...
Annenberg Foundation
Annenberg Learner: Against All Odds: Normal Distributions
A look at how histograms, and the curves that are drawn based on histogram data, can help one analyze data. Video program offers real-life examples to illustrate this: population age and baseball statistics. [28:40]
Math Mammoth
Math Mammoth: How to Make a Histogram and Calculate the Bin Width
Explains how to make a histogram after grouping the data into 'bins.' Also looks at central tendency and variability. [8:10]
Virtual Nerd
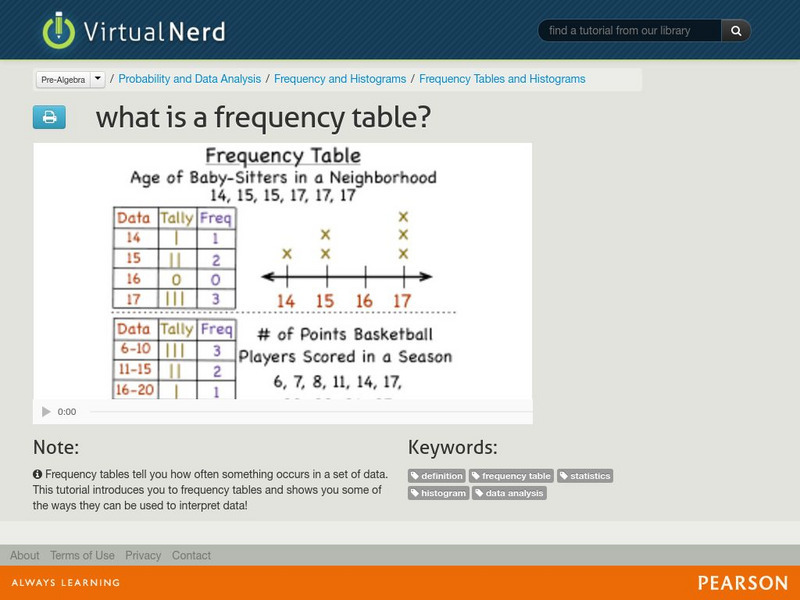
Virtual Nerd: What Is a Frequency Table?
Video serves as an introduction to frequency tables which tell you how often something occurs in a set of data. [6:44]
Virtual Nerd
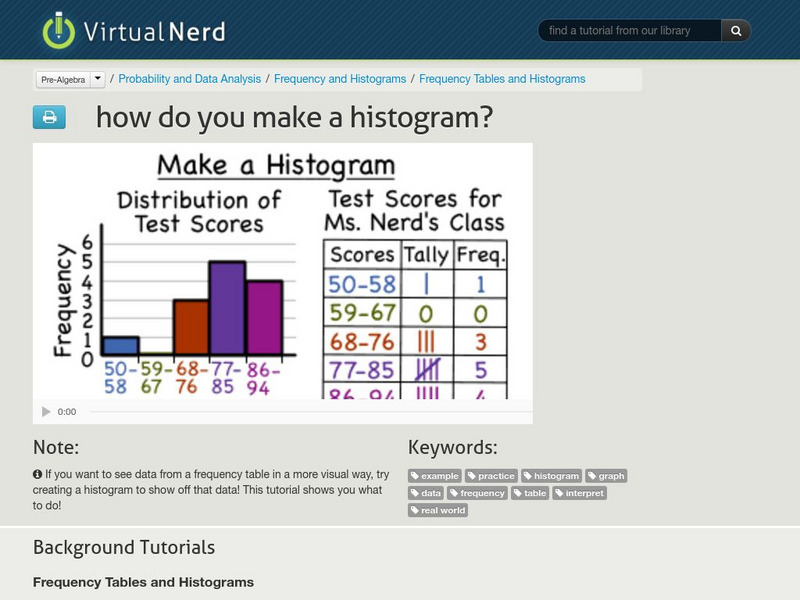
Virtual Nerd: How Do You Make a Histogram?
A histogram is a great way to show off visual data. This tutorial illustrates how to make one. [5:34]
Khan Academy
Khan Academy: Creating a Histogram
Learn how to create histograms, which summarize data by sorting it into buckets.
Sophia Learning
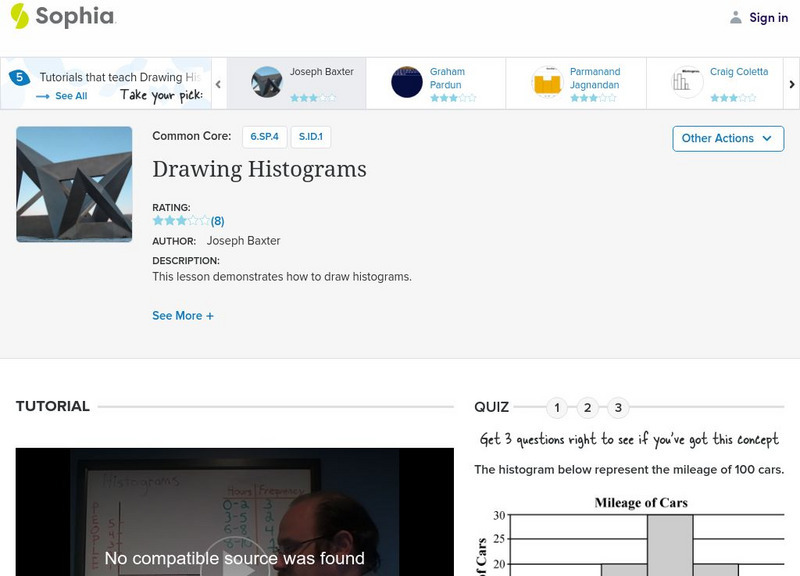
Sophia: Drawing Histograms
This video tutorial demonstrates how to create and read a histogram.
Sophia Learning
Sophia: Drawing Histograms
Explore how to represent data on a histogram. Check understanding with quiz.
Sophia Learning
Sophia: Histogram Tutorial
Determine when to use and how to display data using a histogram.
Sophia Learning
Sophia: Histogram Tutorial
Explore how to organize and display data in a histogram through this tutorial.
Sophia Learning
Sophia: Interpreting Data Using Histograms
This video lesson demonstrates how to interpret data in a histogram. Students can check their understanding with an assessment.
Sophia Learning
Sophia: Interpreting Data Using Histograms
Explore how to interpret data from a histogram.
Sophia Learning
Sophia: Drawing Histograms
Given a data set, explore how to create a histogram. Complete quiz to assess understanding. [9:42]
Virtual Nerd
Virtual Nerd: What Is a Histogram?
Take a look at this video tutorial for information on histograms. [5:23]
Imagine Learning Classroom
Learn Zillion: Create a Histogram
In this lesson, you will learn how to represent data on a number line by creating a histogram. [4:44]


