Hi, what do you want to do?
US Department of Education
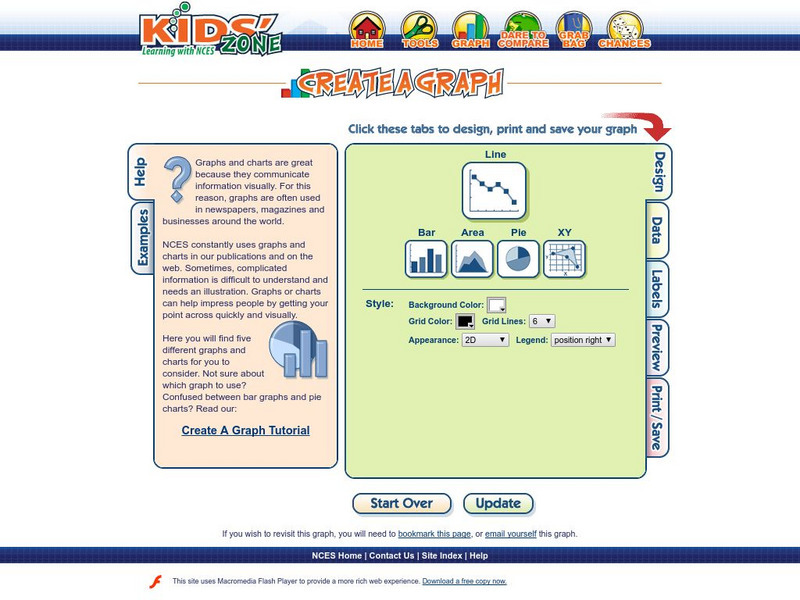
Nces: Create a Graph: Line Graph
This resource from the National Center for Education Statistics provides tools for creating line graphs right online! Select a type of graph, fill in the information, and voila! -- you have created a wonderful graph all your own!
Brown University
Linear Interpolation
This site explains how linear interpolation allows for prediction and gives several examples.
Houghton Mifflin Harcourt
Houghton Mifflin Harcourt: Saxon Activity Center: Real World Investigation: Elevation Changes [Pdf]
Math and geography are the focus of this internet investigation. Learners must plan a road trip to several cities and plot the elevations of those cities using a line graph. Acrobat Reader required.
Sophia Learning
Sophia: Using Graphs to Analyze Data
This lesson will demonstrate how to analyze and interpret data given in the form of a graph.
EL Education
El Education: A Field Guide to East Bog Swamp
This micro-field guide was created by 5th and 6th graders in Marlboro, Vermont. Groups of 3 or 4 students worked together to investigate their own 3 by 3 foot research plot, over multiple visits, and then created a field guide to their...
ClassFlow
Class Flow: Charts Handling Data
[Free Registration/Login Required] Reading graphs fit together with this engaging, colorful flipchart analyzing pie charts, bar graph, percents, and fractions.
ClassFlow
Class Flow: Graphs
[Free Registration/Login Required] This flipchart is a quick review of line, bar, and circle graphs.
Math Is Fun
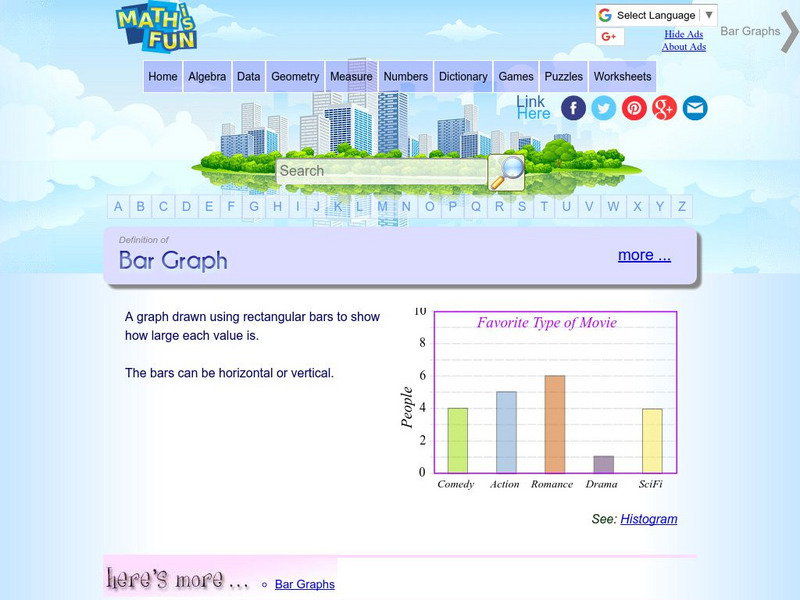
Math Is Fun: Definition of Bar Graph
Get the definition for a bar graph. Then, select the link "here's more" and use the interactive graph to display data as a bar graph, line graph or pie chart. The finished graph may be printed.
McGraw Hill
Glencoe: Using Graphs to Understand Data Quiz
This is a quiz with five quick questions to check your knowledge of how to use graphs to understand data. It is self-checking.
Rice University
Rice University: The Hand Squeeze
Students will enjoy this data collection and class analysis experiment involving the time it takes for a hand squeeze to travel around a circle of people. From organizing the activity to collecting the data to making a table and graphing...
Khan Academy
Khan Academy: Practice: Slope From Graph
In this practice quiz, students are asked to determine the slope of each line graph. Includes hints.


![Houghton Mifflin Harcourt: Saxon Activity Center: Real World Investigation: Elevation Changes [Pdf] Activity Houghton Mifflin Harcourt: Saxon Activity Center: Real World Investigation: Elevation Changes [Pdf] Activity](https://static.lp.lexp.cloud/images/attachment_defaults/resource/large/FPO-knovation.png)


