Bozeman Science
Data
New ReviewIn this video Paul Andersen shows you how to analyze and interpret data in a mini-lesson on Data. Two examples are included in the video and two additional examples are included in the linked thinking slides.
Crash Course
Data Structures: Crash Course Computer Science
Today we’re going to talk about on how we organize the data we use on our devices. You might remember last episode we walked through some sorting algorithms, but skipped over how the information actually got there in the first place! And...
Curated Video
The Art of Doing - Web Development for Beginners - Organizing Text with Tables
In this video, you will learn how to use tags such as table, tr, th, td, caption, details, and summary to create tables of elements on a web page. This clip is from the chapter "Basic HTML Tags" of the series "The Art of Doing - Web...
Curated Video
Organizing Data with Bar Graphs
In this video, the concept of organizing data using bar graphs is explained. The video discusses how data can be categorized and represented visually using a bar graph, with one axis representing categories and the other axis...
Curated Video
Organizing Data with Tables
Walk through an example of animals at a pet store and to gain an understanding of how to categorize them and count the number of animals in each category. The teacher explains how to label and record the data in an organized table, both...
Curated Video
Finding the Area of a Complex Shape
This video explains how to find the total area of a complex shape by breaking it down into simpler shapes and counting the square units. It emphasizes the importance of finding the area of each individual shape and then adding them...
Sophia Learning
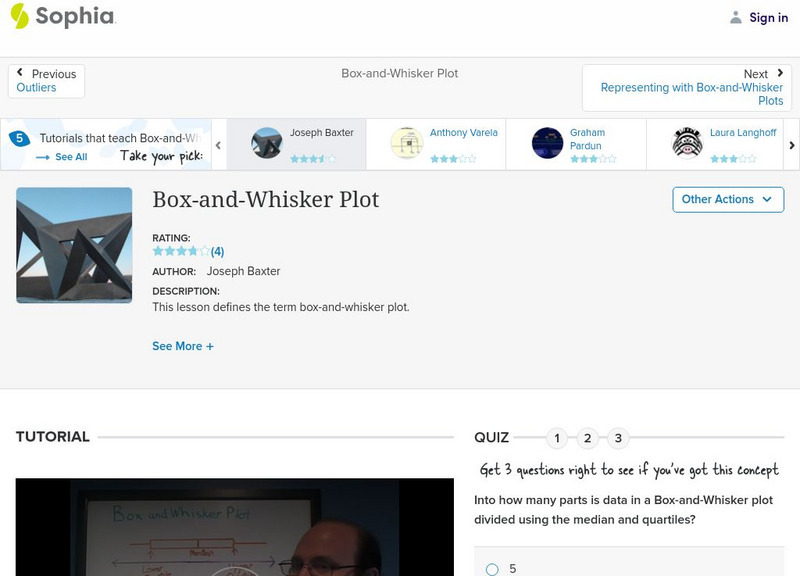
Sophia: Box and Whisker Plot
Box-and-whisker plots are explored in this video tutorial. The lesson reviews how to set up the graph and labels the parts of a box-and-whisker plot.
Sophia Learning
Sophia: Drawing Histograms
This video tutorial demonstrates how to create and read a histogram.
Sophia Learning
Sophia: Back to Back Stem and Leaf Plots
This video tutorial demonstrates how to read and compare data using a back-to-back stem-and-leaf plot.
Sophia Learning
Sophia: Creating a Stemplot: Lesson 6
This video lesson [2:11] goes over the steps for constructing a complete stem plot. It is 6 of 8 in the series titled "Creating a Stemplot."
Sophia Learning
Sophia: Creating a Quantity Pictograph
This video lesson demonstrates how to create a quantity pictogram.


