Hi, what do you want to do?
Virtual Nerd
Virtual Nerd: What Is a Frequency Table?
Frequency tables tells you how often something occurs in a set of data. Watch this video for examples of frequency tables. [6:44]
Virtual Nerd
Virtual Nerd: How Do You Make a Frequency Table?
How can you visually show what occurs most often in a set of data? A frequency table is one way! Watch the step by step process on how to make a frequency table from a data set. [8:06]
Sophia Learning
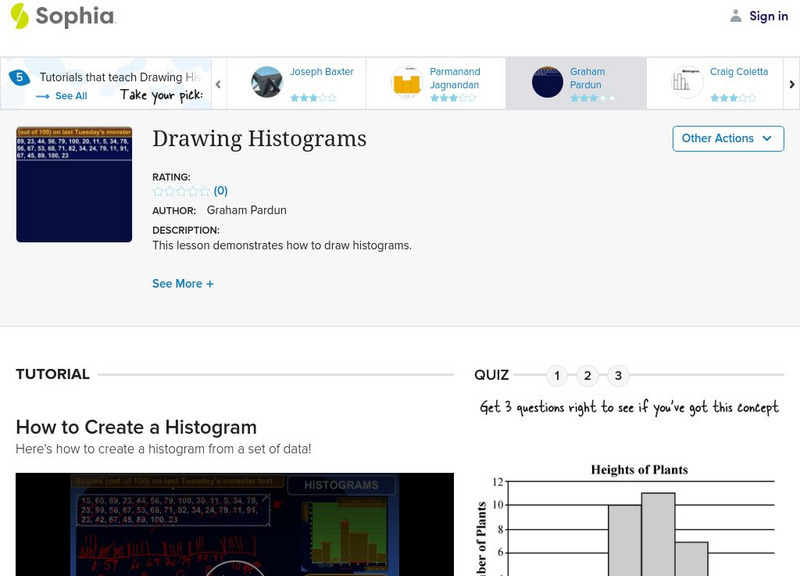
Sophia: Drawing Histograms
Explore how to represent data on a histogram. Check understanding with quiz.
Sophia Learning
Sophia: Getting I Nformation Out of Stem and Leaf Plots
Use stem-and-leaf plots to determine the mean, median, mode, and least and greatest values. Take quiz to check understanding.
Sophia Learning
Sophia: Graphing Scatter Plots
Use collected data to graph scatter plots on a coordinate plane. Take quiz to check understanding.
Sophia Learning
Sophia: Graphing Scatter Plots
Create a scatter plot by displaying data on a coordinate plane. Assess understanding with a quiz.
Sophia Learning
Sophia: Interpreting Data Using Histograms
Explore how to interpret data from a histogram.
Sophia Learning
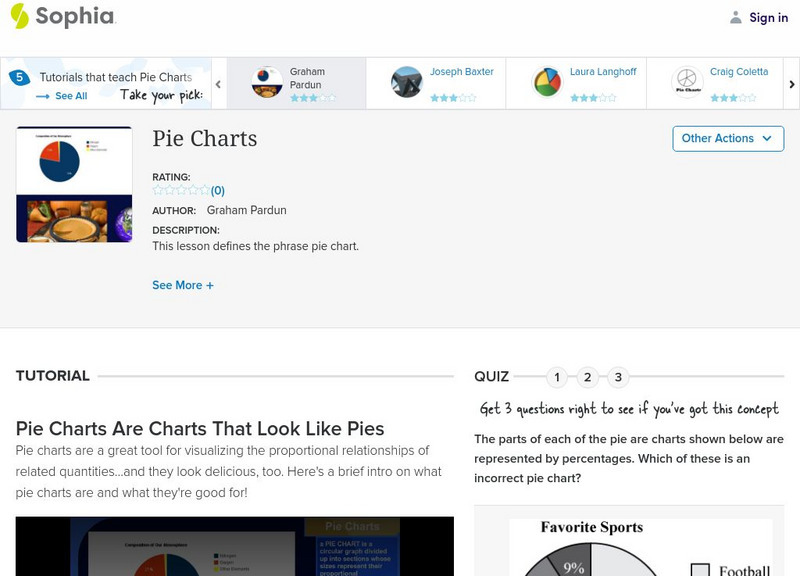
Sophia: Pie Charts
Explore how data is represented on a pie chart and how to interpret the data. Take a quiz to assess learning.
Sophia Learning
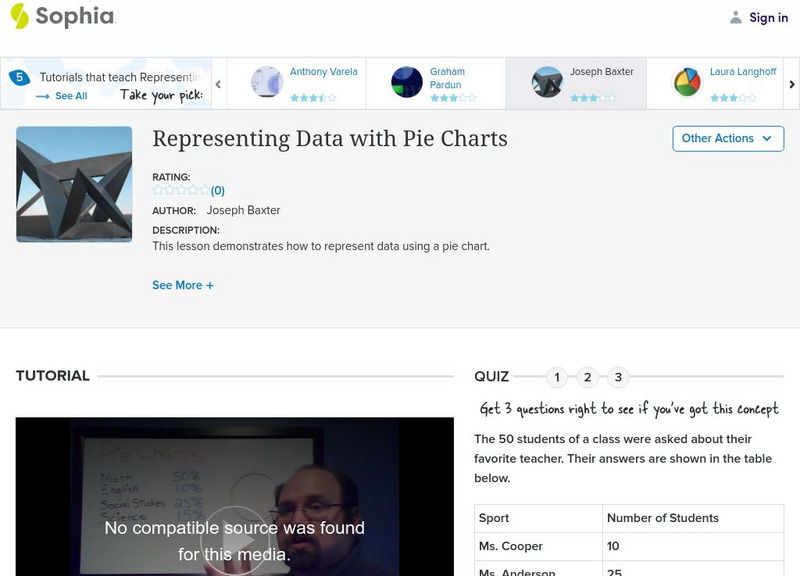
Sophia: Representing Data With Pie Charts
Explore how to use data to create a pie chart and take a quiz to assess learning.
Sophia Learning
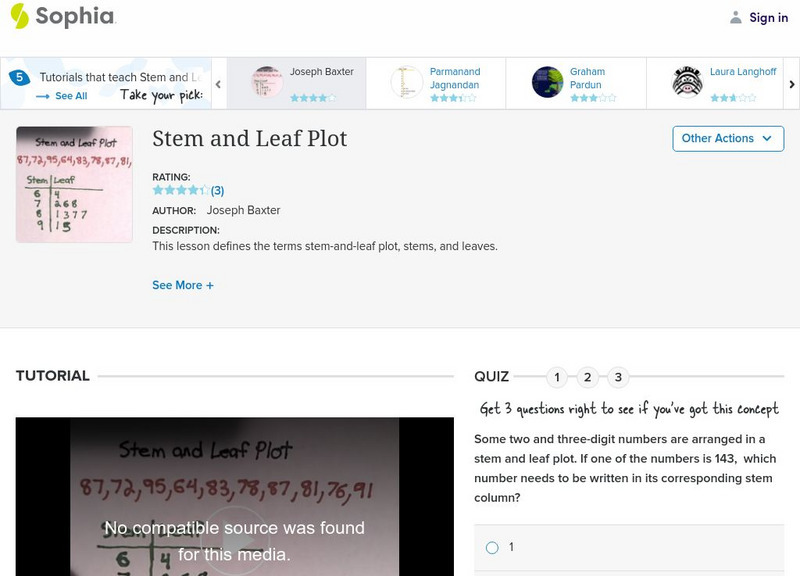
Sophia: Stem and Leaf Plot
Look at the frequency of numbers in the data set using a stem and leaf plot. Check understanding with a quiz.
Sophia Learning
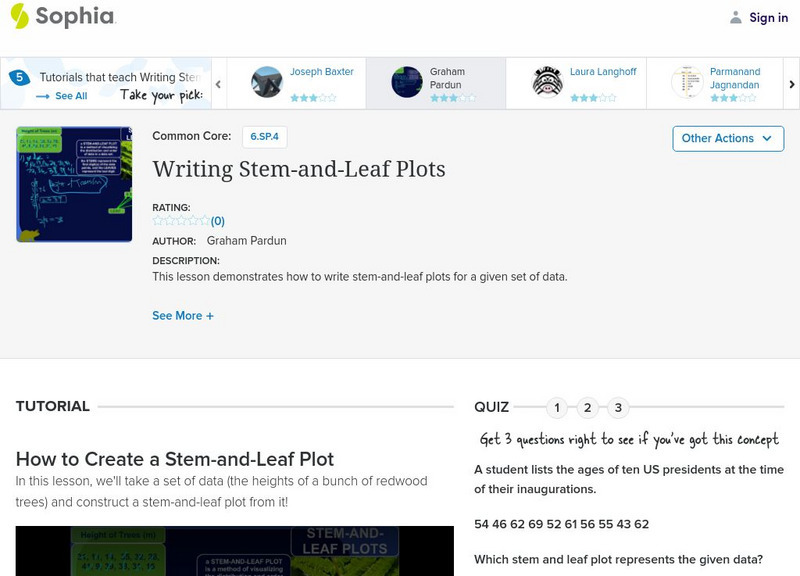
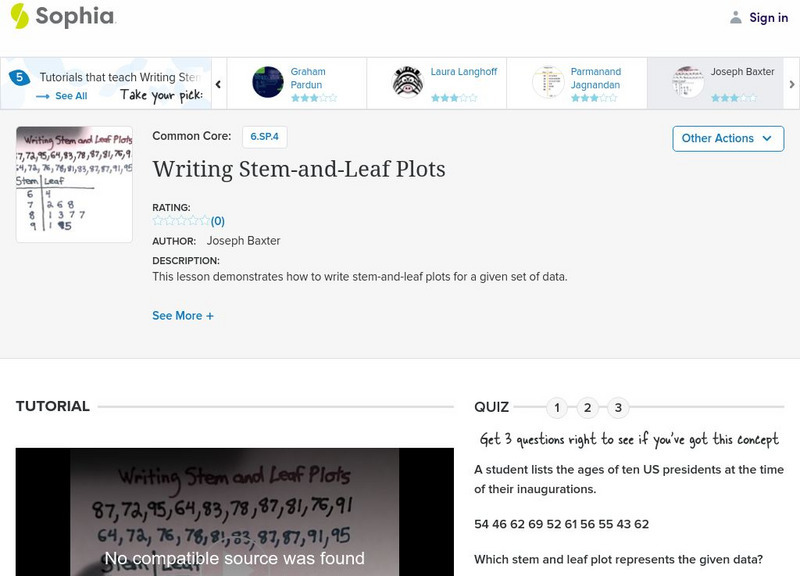
Sophia: Writing Stem and Leaf Plots
Use data sets to write stem-and-leaf plots. Check understanding with a quiz.
Sophia Learning
Sophia: Writing Stem and Leaf Plots
Write a stem-and-leaf plot from a given set of data and assess learning with a quiz.
Imagine Learning Classroom
Learn Zillion: Use the Information From More Than One Line Plot to Solve Problems
In this lesson, you will learn how to solve a multi-step problem by using information presented multiple line plots. [4:37]
Imagine Learning Classroom
Learn Zillion: Identify Clusters, Peaks and Gaps in a Dot Plot
In this lesson, you will learn how to identify clusters, peaks and gaps and their relationship to the data by examining the distribution on a dot plot. [4:01]
Sophia Learning
Sophia: Drawing Histograms
Given a data set, explore how to create a histogram. Complete quiz to assess understanding. [9:42]
Crash Course
Crash Course Navigating Digital Information #8: Data & Infographics
Today, we're going to discuss how numbers, like statistics, and visual representations like charts and infographics can be used to help us better understand the world or profoundly deceive. Data is a really powerful form of evidence...
Loyola University Chicago
Math Flix: Graphs: Literature "Tiger Math"
This QuickTime movie uses the children's book, "Tiger Math" as a starting point for using graphs to tell a story. As you watch and listen to the teacher and student interact it helps clarify the thinking behind applying this concept.
Sophia Learning
Sophia: Creating a Graph From a Table: Lesson 4
In this video lesson [4:12], students see how to extract information from a table and insert it into a graph. It is 4 of 8 in the series titled "Creating a Graph from a Table."
Sophia Learning
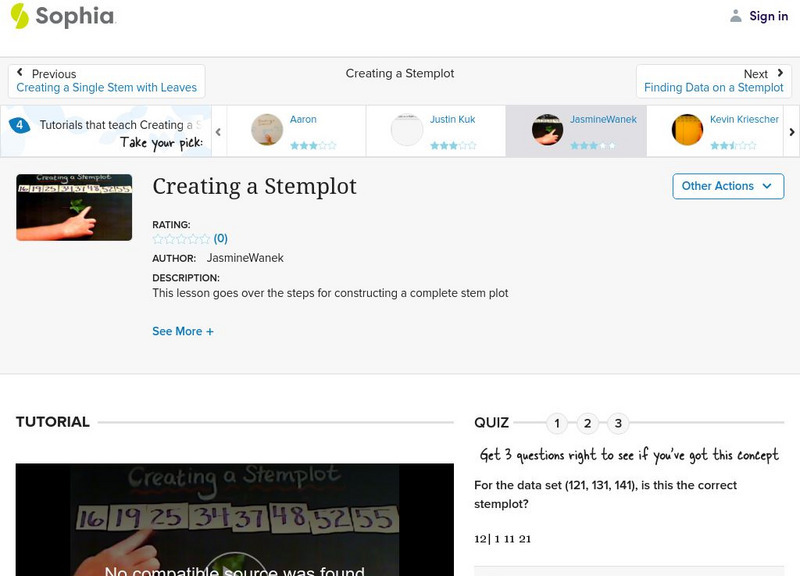
Sophia: Creating a Stemplot: Lesson 5
This video lesson [4:46] goes over the steps for constructing a complete stem plot. It is 5 of 8 in the series titled "Creating a Stemplot."
Loyola University Chicago
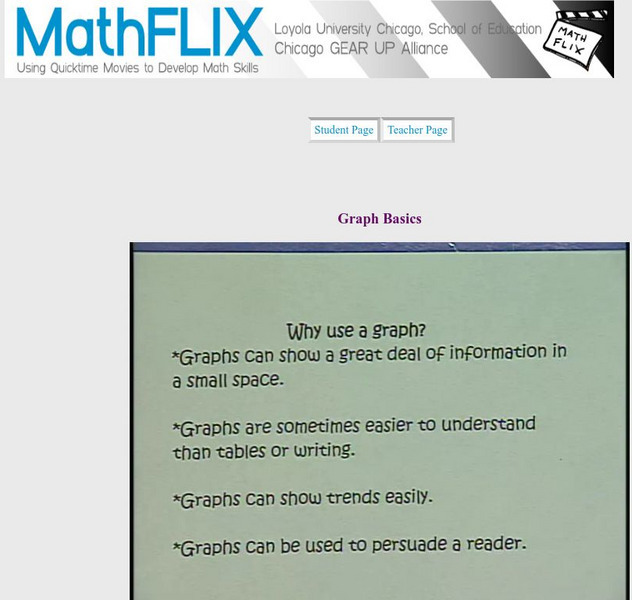
Math Flix: Graphs: Basics
This QuickTime movie reviews basic concepts for graphs. As you watch and listen to the teacher and student interact it helps clarify the thinking behind applying this concept.
Loyola University Chicago
Math Flix: Graphs: Matching Stories to Graphs Part 2
This QuickTime movie provides more opportunities to match stories to graphs. As you watch and listen to the teacher and student interact it helps clarify the thinking behind applying this concept.


