Bloomberg
The Risks and Rewards of Protectionism
May 27 -- Frederik Nerbrand, HSBC's head of asset allocation, discusses the rise of protectionism with Bloomberg's Scarlet Fu, Alix Steel and Oliver Renick on "What'd You Miss?"
Bloomberg
The Economic Cost of the U.S. Opioid Epidemic
Sep.18 -- Princeton University Professor of Economics Alan Krueger offers insight into his new report on the economic impact of the U.S. opioid crisis. He speaks with Bloomberg's David Westin on "Bloomberg Daybreak: Americas."
Bloomberg
There's Never Been a Better Time for Crypto: Michael Sonnenshein
Jan.25 -- Bitcoin rebounded from its sharp sell off last week which saw prices plunge more than 12%, the steepest weekly drop since last March. Michael Sonnenshein, CEO of Grayscale, speaks with Bloomberg's Caroline Hyde, Romaine Bostick...
Bloomberg
Fixing the Flaws in America's Pension System
Nov.30 -- David Hunt, chief executive officer at PGIM, addresses the issues experienced by public and private pension systems and the risks that investment strategists are forced to take to fund the accounts. He speaks with Bloomberg's...
Texas Education Agency
Texas Gateway: Study Edge Statistics: Comparing Distributions
This lesson discusses how to compare distributions of categorical data using different methods of display, e.g., bar charts, pie charts, and frequeny tables. Includes downloadable study guide with exercises - guide also covers other...
Sophia Learning
Sophia: Creating a Key for a Pie Chart: Lesson 6
This video lesson [2:48] goes over the steps for creating a key to go with a pie chart. It is 6 of 7 in the series titled "Creating a Key for a Pie Chart."
Sophia Learning
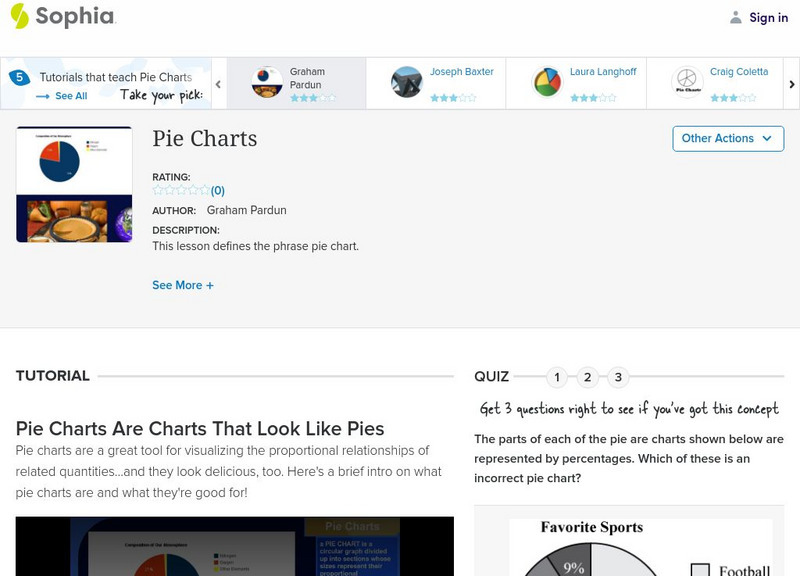
Sophia: Pie Charts
Explore how data is represented on a pie chart and how to interpret the data. Take a quiz to assess learning.
Sophia Learning
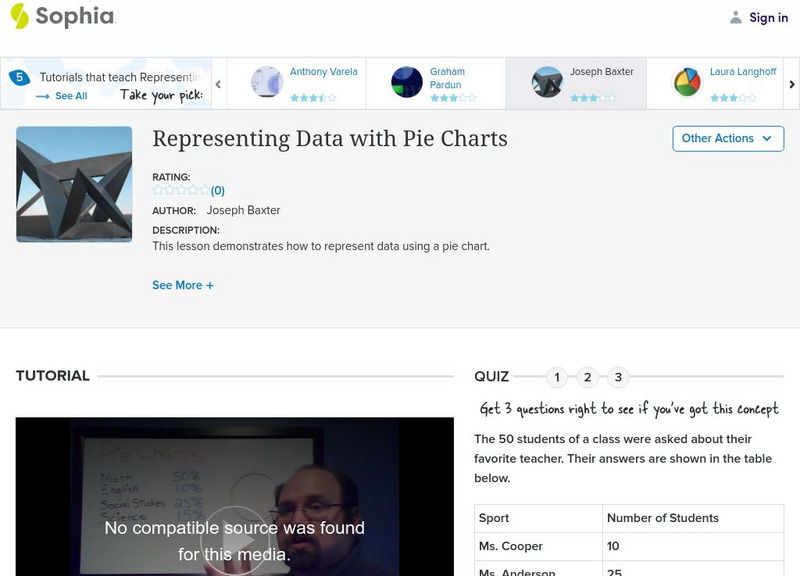
Sophia: Representing Data With Pie Charts
Explore how to use data to create a pie chart and take a quiz to assess learning.
Khan Academy
Khan Academy: Statistics: Reading Pie Graphs (Circle Graphs)
Video demonstration of reading pie graphs/circle graphs to answer questions. [3:09]
PBS
Pbs: Communication System to Support Active Engagement in Predictable Chart Writing
This video, effective for engaging students with significant cognitive disabilities, demonstrates predictable chart writing.
Sophia Learning
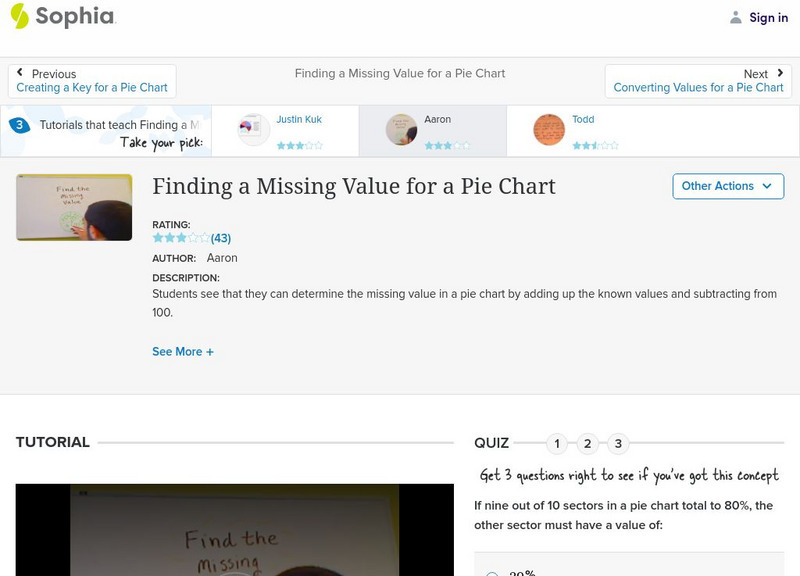
Sophia: Finding a Missing Value for a Pie Chart: Lesson 6
Students see that they can determine the missing value in a pie chart by adding up the known values and subtracting from 100. This lesson is 6 of 9 in the series titled "Finding a Missing Value for a Pie Chart."
Sophia Learning
Sophia: Finding a Missing Value for a Pie Chart: Lesson 1
Students see that they can determine the missing value in a pie chart by adding up the known values and subtracting from 100. This lesson is 1 of 9 in the series titled "Finding a Missing Value for a Pie Chart."


