Bozeman Science
Position vs. Time Graph - Part 2
Mr. Andersen shows you how to read a position vs. time graph to determine the velocity of an object. Objects that are accelerating are covered in this podcast. He also introduces the tangent line (or the magic pen).
Bozeman Science
Position vs. Time Graph - Part 1
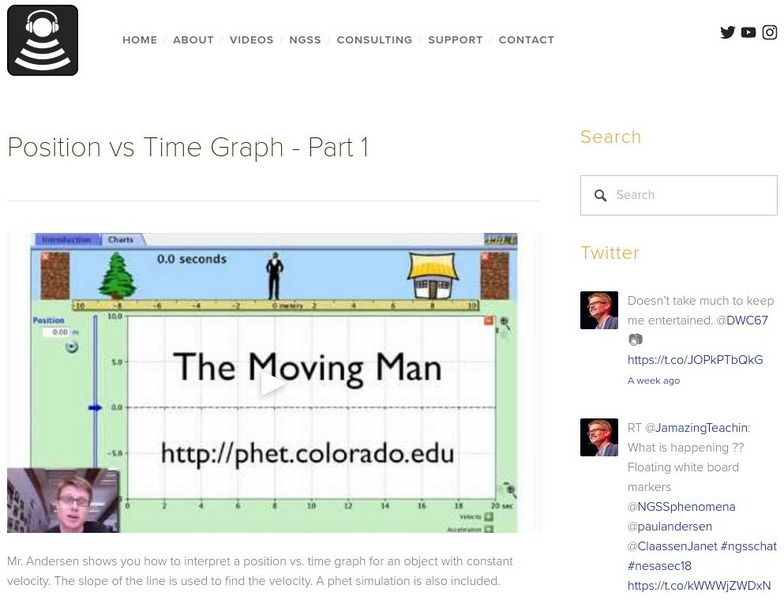
Mr. Andersen shows you how to interpret a position vs. time graph for an object with constant velocity. The slope of the line is used to find the velocity. A phet simulation is also included.
Khan Academy
Khan Academy: Position vs. Time Graphs
This video teaches the viewer how to read a position vs. time graph. It explains how to use the graph to determine the following quantities: displacement, distance, average velocity, average speed, instantaneous velocity, and...
Science Education Resource Center at Carleton College
Serc: Analysis of Simple Harmonic Oscillator in a Single Video Clip
A video clip of a glider on a low-friction air track can be used to analyze many aspects of simple harmonic motion. This clip includes graphs that are synchronized to the motion that show position vs time, velocity vs time, and...
Bozeman Science
Bozeman Science: Position vs Time Graph Part 1
Mr. Andersen shows you how to interpret a position vs. time graph for an object with constant velocity. The slope of the line is used to find the velocity. A PhET simulation is also included. [12:19]
Bozeman Science
Bozeman Science: Position vs Time Graph Part 2
Mr. Andersen shows you how to read a position vs. time graph to determine the velocity of an object. Objects that are accelerating are covered in this video. He also introduces the tangent line (or the magic pen). [13:01]
Other
Drawing Acceleration vs Time Graphs
Explains the differences between the graphs of position vs. time, velocity vs. time, and acceleration vs. time. Demonstrates how to use the information from a velocity-time graph to create an accleration-time graph. [8:27]


