Hi, what do you want to do?
Curated OER
Sampling Distributions
Pupils analyze sampling from different population. In this statistics instructional activity, students define the meaning of sample sizes and what causes an increase or decrease. They graph their data on the Ti calculator and draw...
Curated OER
Normal Curve Areas
In this normal curve areas worksheet, students follow 6 steps to compute the probability regarding the possible sample of proportions using a large sample population. First, they label the Ps-scale with the proportion and corresponding...
Missouri State University
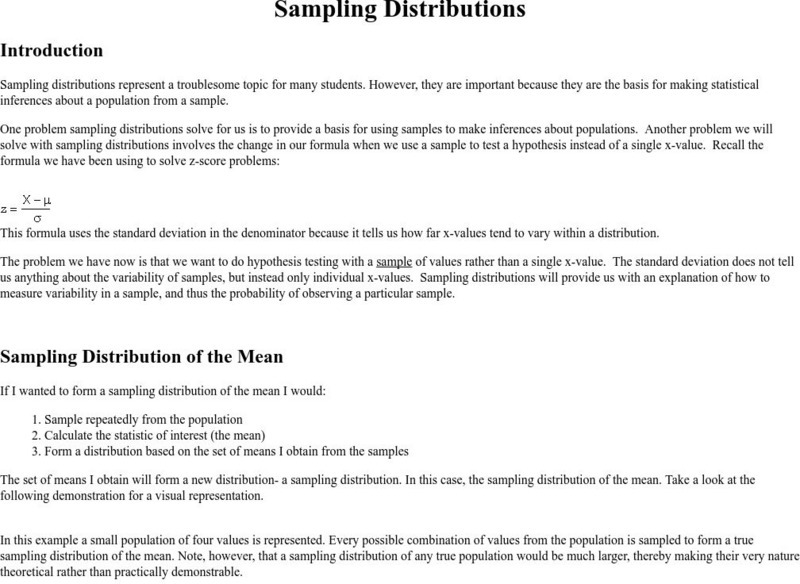
Missouri State University: Introductory Statistics: The Sampling Distribution
A review is provided at the start of this resource, then the more specific discussion of sampling distributions gets under way. Graphs are provided for ease in understanding the material.
Science Education Resource Center at Carleton College
Serc: Reese's Pieces Activity: Sampling From a Population
Students use Reese's Pieces to investigate the proportion of orange candies present in a set of 25. After collecting data for the class, they use a web applet to collect more data for random samples. This is compared to the actual...
Other
American Statistical Association: Using Dice to Introduce Sampling Distributions
In this lesson, students use a dice simulation to investigate how random sampling affects the properties of the distribution of a sample proportion, and are introduced to the sampling distribution of the sample proportion.
Other
American Statistical Association: Who Sends the Most Text Messages? [Pdf]
In this detailed lesson looking at text messaging behavior, learners investigate the sampling distribution for the sample mean to learn what factors affect its shape. They will also be introduced to the Central Limit Theorem.
Khan Academy
Khan Academy: Sampling Distribution of a Sample Proportion Example
Presents a problem that is similar to what might be on an AP Statistics exam. Walks students through each step for solving it and students input answers to questions along the way.
Rice University
Rice Virtual Lab in Statistics: Sampling Distributions
This Java Applet lets you explore various aspects of sampling distributions.
Texas Instruments
Texas Instruments: Sampling Distributions
Students study the distribution of sample proportions with a simulation. They find a small sample size leads to skewed distribution and as the sample size increases, the distribution becomes more normal.
Texas Instruments
Texas Instruments: Simulation of Sampling Distributions
This set contains questions about simulating sampling distributions. Students see graphs of simulated distributions enabling them to reach conclusions about mean, shape, and standard deviation.
Texas Instruments
Texas Instruments: Sampling Distribution of Differences
This activity covers the distribution of a difference between two independent sample proportions or two independent sample means.
Stefan Warner and Steven R. Costenoble
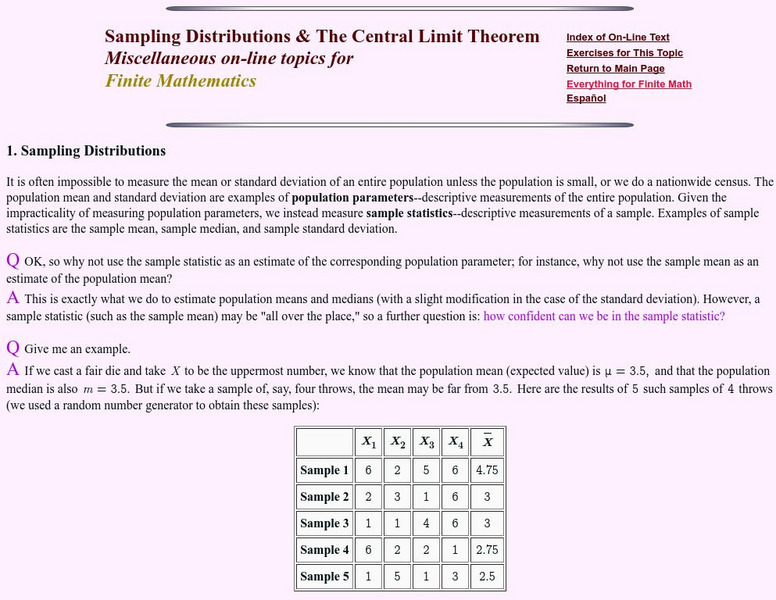
Finite Mathematics & Applied Calculus: Sampling Distributions and the Central Limit Theorem
Students learn about sampling distributions and the Central Limit Theorem. Topics explored are sample mean, population mean, and using the Central Limit Theorem. The tutorial investigates the statistics concepts through class notes and...
University of Baltimore
University of Baltimore: Sampling Distribution
A complete definition of sampling distribution as well as the beginning of a discussion concerning were sampling distribution fits into the topic of statistics. Written by Dr. Hossein Arsham.
Other
Fayetteville State Univ.: Sampling Distributions
A detailed explanation of statistical sampling distributions is provided here. Several graphs are attached to aid in understanding. The sampling distribution of the mean and the Central Limit Theorem are also discussed at this site.
Science Education Resource Center at Carleton College
Serc: Simulating the Effect of Sample Size on Sampling Distribution of the Mean
Using a Java simulation tool, students investigate how sample size is related to the amount of variability one sees in the sampling distribution of the mean. Increasing the sample size decreases the variability. Students are assigned...
Science Education Resource Center at Carleton College
Serc: Using an Applet to Demonstrate a Sampling Distribution
In this activity students are exposed to the concept of sampling distributions by creating an example as a class. By having the students assemble the data, they can more readily understand that a sampling distribution is made up of a...
CK-12 Foundation
Ck 12: Statistics: Student's T Distribution
[Free Registration/Login may be required to access all resource tools.] This Concept introduces the Student's t-distribution and degrees of freedom.
CK-12 Foundation
Ck 12: Statistics: Tests of Single Variance
[Free Registration/Login may be required to access all resource tools.] This Concept introduces students to testing variance using the chi-square distribution as well as creating a confidence interval for the variance.
Illustrative Mathematics
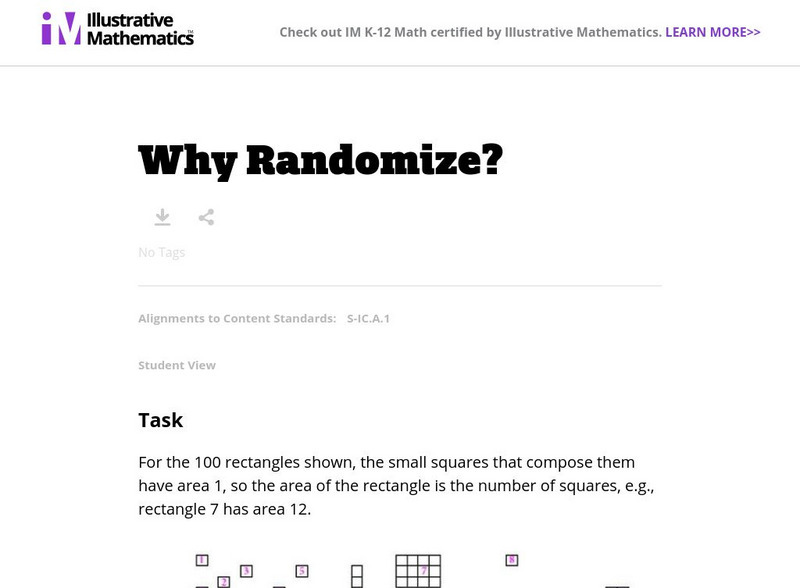
Illustrative Mathematics: S Ic Why Randomize?
The exercise demonstrates that judgment (non-random) samples tend to be biased in the sense that they produce samples that are not balanced with respect to the population characteristics of interest. Students will estimate the mean...
CK-12 Foundation
Ck 12: Statistics: Applications of Normal Distributions
[Free Registration/Login may be required to access all resource tools.] This Concept introduces students to applications of the Normal Distribution.
CK-12 Foundation
Ck 12: Statistics: Central Limit Theorem
[Free Registration/Login may be required to access all resource tools.] Introduces students to the Central Limit Theorem. Students will learn about the Central Limit Theorem and calculate a sampling distribution using the mean and...
University of Glasgow
Steps Statistics Glossary: Sampling Distribution
This site provides an overview of sampling distribution and associated terms.


