PBS
Pbs Mathline: Wet Heads Lesson Plan [Pdf]
Middle schoolers will record the number of drops of water in a stem-and-leaf plot that will fit on top of a penny. Printable lesson.
Annenberg Foundation
Annenberg Learner: Making a Stem and Leaf Plot
A line plot may not be a useful graph for investigating variation so we must come up with a new representation based on groups of data. Construct a stem and leaf plot from a set of 26 data values.
Other
Online Statistics Education: Graphing Distributions [Pdf]
This is the second chapter of a statistics e-text developed collaboratively by Rice University, University of Houston Clear Lake, and Tufts University. It looks at many different types of data displays and the advantages and...
Cuemath
Cuemath: Stem and Leaf Plot
A comprehensive guide for learning all about stem and leaf plots with definitions, how to construct them, solved examples, and practice questions.
Houghton Mifflin Harcourt
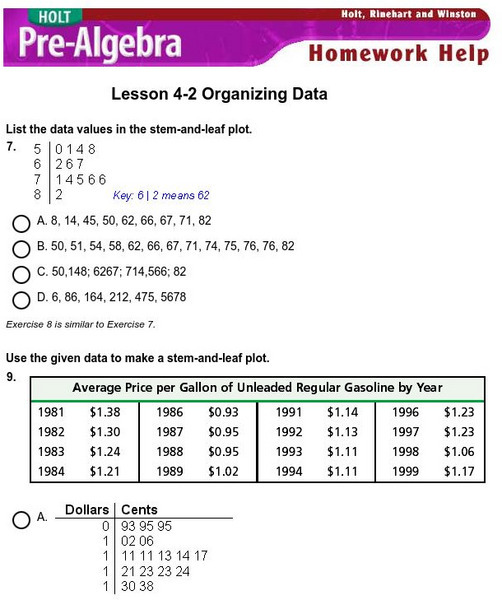
Holt, Rinehart and Winston: Homework Help Independent Practice: Stem and Leaf Plot
Get independent practice organizing data and using stem-and-leaf plots. Each incorrect response gets a text box explanation and another try. Correct responses are confirmed.
University of Georgia
University of Georgia: Definitions in Statistics
This site contains definitions to use in statistics and ways to collect data.
University of Georgia
University of Georgia: Measures of Variation
Lesson plan introduces and explains how to calculate measures of variation concepts such as range and quartile.
Shodor Education Foundation
Shodor Interactivate: Stem and Leaf Plot
Shodor offers this interactive Stem and Leaf Plotter. The mean, median, and mode may be calculated or checked for accurracy with your given data. Be sure to check the "What?" link to find exercises and a lesson plan.
Texas Instruments
Texas Instruments: How Far to Your Birthplace
Examine one-variable data analysis through the creation and exploration of a birth place data set. Graphing calculators are used to analyze the data through mean, median, mode, maximum, minimum, stem-and-leaf plots and box-and-whisker...
Scholastic
Scholastic: Study Jams! Math: Data Analysis: Stem and Leaf Plots
Explore step by step how to organize and create stem and leaf plots. Then test your knowledge for understanding.
Mangahigh
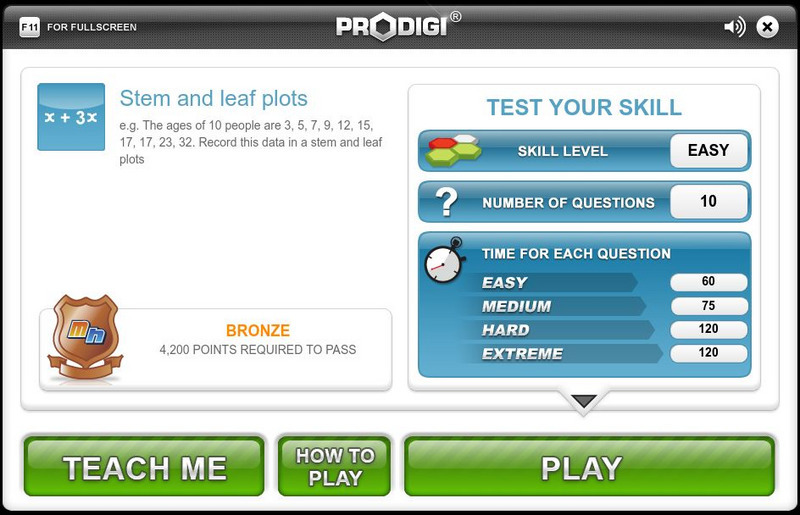
Mangahigh: Data: Stem and Leaf Plots
This site provides students practice with the concept of stem and leaf plots. Students can learn about the topic by completing an interactive tutorial. Students can then take a ten question timed test to practice the skill.
CK-12 Foundation
Ck 12: Statistics: Stem and Leaf Plots, Mean, Median, and Mode
[Free Registration/Login may be required to access all resource tools.] Find the mean, median, and mode of a set of data displayed in a stem-and-leaf plot.
Math Is Fun
Math Is Fun: Stem and Leaf Plots
Explains, with examples, what stem and leaf plots are. Includes a set of practice questions.
Annenberg Foundation
Annenberg Learner: Organizing Data in a Stem and Leaf Plot
A stem and leaf plot is a graphical representation for investigating variation. You will convert an ordered stem and leaf display grouped by tens into an ordered display grouped by fives.
Oswego City School District
Regents Exam Prep Center: Practice With Organizing and Interpreting Data
Several problems are presented to test your skills in creating and interpreting frequency tables, pie charts, box-and-whisker and stem-and-leaf plots.
Math Planet
Math Planet: Stem and Leaf Plots and Box and Whiskers Plot
Discover how to use stem-and-leaf plots and box-and-whisker plots to visualize data by taking a look at examples and a video lesson.
CK-12 Foundation
Ck 12: Types of Data Representation: Graphic Displays of Data
[Free Registration/Login may be required to access all resource tools.] Here you will explore displays of data using bar charts, histograms, pie charts and boxplots, and learn about the differences and similarities between them and how...
CK-12 Foundation
Ck 12: Statistics: Stem and Leaf Plots and Histograms
[Free Registration/Login may be required to access all resource tools.] Make and interpret stem-and-leaf plots and histograms for a set of data.
Alabama Learning Exchange
Alex: Heads Up!
The instructional activity is a hands-on project. Students will work in pairs to gather various measurements, organizing the data into a provided chart. The measurements will be used to review, reinforce, and introduce skills such as...
Better Lesson
Better Lesson: Stem and Leaf Plots Activity
This activity is designed so that the students create their own Around the Room activity. They will be collecting data, displaying it in a stem and leaf plot, and then developing questions around their display for other students to answer!
Better Lesson
Better Lesson: Places Everyone. Analyzing and Creating Stem and Leaf Plots
The students will be using discovery techniques to learn about stem and leaf plots.
Purple Math
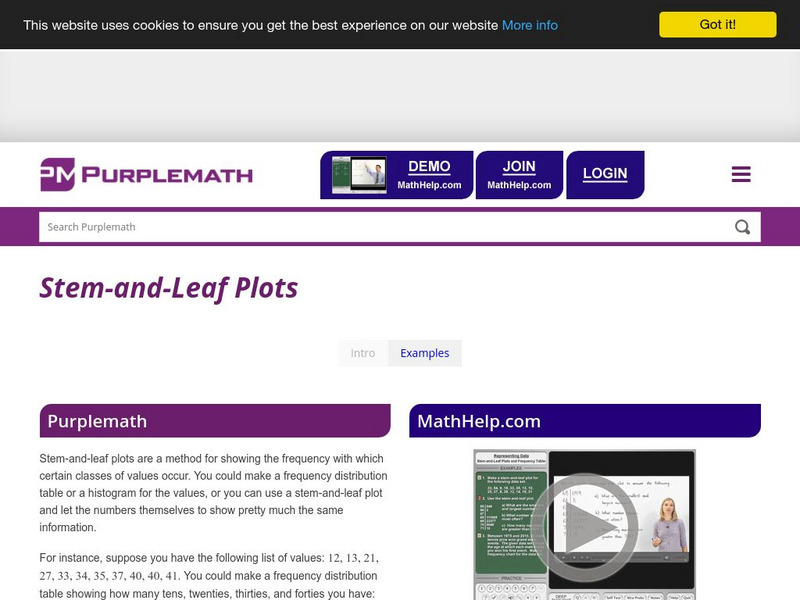
Purplemath: Stem and Leaf Plots
Explains how to create a stem-and-leaf plot from a data set. Demonstrates how to format a clear stem-and-leaf plot.
Shodor Education Foundation
Shodor Interactivate: Lesson: Stem and Leaf Plots
Lesson plan introduces students to stem-and-leaf plots. Many resources are available for student and teachers here.
Other
Northern Michigan University: Stem and Leaf Plot
Site discusses how to use stem-and-leaf plots with an example and the steps listed for easy reading.
![Pbs Mathline: Wet Heads Lesson Plan [Pdf] Lesson Plan Pbs Mathline: Wet Heads Lesson Plan [Pdf] Lesson Plan](https://static.lp.lexp.cloud/images/attachment_defaults/resource/large/FPO-knovation.png)
